
Enbridge (ENB) enters late 2025 with momentum in its core midstream and utility-like businesses, reflected in a sharp 31.20% year-over-year lift in quarterly revenue and a share price that recovered into early autumn before consolidating. The improvement likely stems from higher system throughput, inflation-linked tariff escalators, and contributions from recently added regulated assets, while signaling resilient demand for North American gas and liquids transport. For investors, the shift matters because cash generation is trending up just as balance sheet leverage remains elevated at 101.13B of total debt, keeping funding costs and refinancing terms central to the equity story. Midstream operators typically trade on the durability of contracted cash flows and the path of interest rates; ENB’s scale, diversified networks, and dividend reputation can support that profile if execution stays on track. The next phase is about translating operating gains into sustained free cash flow after dividends, measured by disciplined capital allocation, regulatory clarity, and timely project completions.
Key Points as of October 2025
- Revenue: trailing 12-month revenue stands at 64.48B; quarterly revenue growth is 31.20% year over year.
- Profit/Margins: operating margin (ttm) 18.09% and profit margin 10.28%; diluted EPS (ttm) 2.02; EBITDA 16.89B.
- Cash generation: operating cash flow (ttm) 12.93B; levered free cash flow 2B, reflecting heavy investment and funding needs.
- Balance sheet: total debt 101.13B; debt/equity 147.94%; current ratio 0.75; cash on hand 1.22B.
- Dividend: forward annual dividend yield 5.83%; trailing yield 7.87%; payout ratio 130.81% (based on earnings).
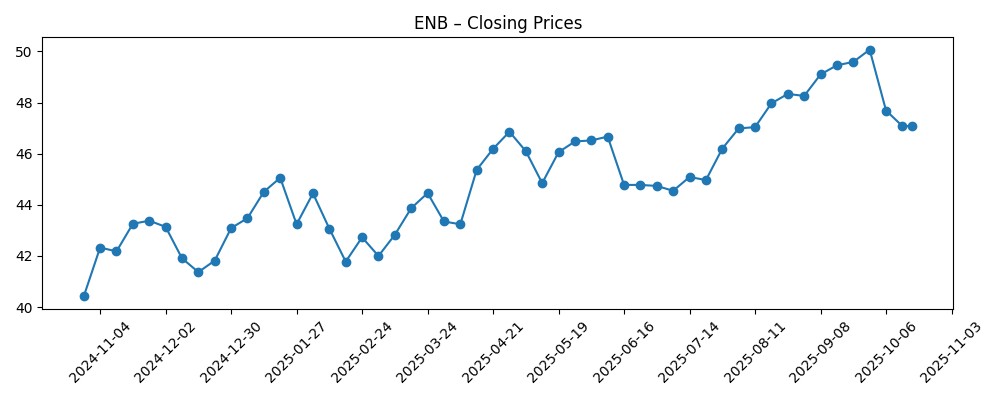
- Share price: 52-week change 13.34%; high 50.54 and low 39.73; 50-day MA 48.43 vs. 200-day MA 45.54; recent weekly close 47.08 (2025-10-17).
- Analyst/positioning: consensus ratings not provided; short interest 0.90% of float (short ratio 6.54); institutions hold 55.82%.
- Market cap/float: large-cap profile with 2.18B shares outstanding and float of 2.18B; market capitalization not disclosed in provided data.
- Qualitative: diversified pipelines and regulated utility-like assets with FX exposure (USD/CAD) and regulatory oversight; beta 0.86 indicates below-market volatility.
Share price evolution – last 12 months
Notable headlines
Opinion
ENB’s latest trendline pairs healthy top-line acceleration with stable profitability, a combination that typically underpins midstream valuations. The 31.20% year-over-year quarterly revenue growth, alongside an 18.09% operating margin, suggests volumes and tariff escalators are working in tandem, with potential contributions from newly integrated regulated assets. Importantly, EBITDA of 16.89B and EPS of 2.02 point to scale benefits and cost discipline flowing through the income statement. The share price climbed into September before a modest consolidation, consistent with a market weighing improving cash generation against macro rate uncertainty. In short, earnings quality looks serviceable: recurring, contracted revenue is doing the heavy lifting, and margin structure remains resilient despite mixed commodity tapes, because pipelines and gas utilities are less price-exposed and more throughput- and rate-driven.
The crux is funding. ENB’s 101.13B in total debt, 147.94% debt/equity, and a 0.75 current ratio keep refinancing, maturities, and spreads central to equity sentiment. Operating cash flow of 12.93B covers capex and interest but leaves a relatively thin levered free cash flow of 2B after obligations. The reported payout ratio of 130.81% (earnings-based) highlights the sector nuance: investors often assess dividends on distributable cash flow, not GAAP EPS, but the headline ratio still focuses attention on coverage, capex pacing, and potential asset recycling. If management can translate revenue momentum into rising free cash flow after dividends—via disciplined capital allocation and timely project execution—concerns about leverage and payout sustainability should ease, allowing the equity narrative to shift from balance sheet to growth and resilience.
Industry structure should stay favorable for ENB’s mix. North American gas demand remains supported by power generation needs and LNG-linked infrastructure, while liquids pipelines benefit from basin productivity and export connectivity. These dynamics, plus inflation-linked rate mechanisms common in long-term contracts, tend to stabilize cash flows through cycles. The flip side is regulatory friction: permits and rate cases can delay in-service dates, raise costs, or affect allowed returns. FX adds another layer, as USD/CAD moves influence translated results. Execution on a multi-asset footprint—pipe, distribution utilities, and storage—matters as much as macro tailwinds; delays or overruns can quickly dent the free-cash trajectory even when volumes are firm.
Valuation hinges on two levers: the cost of capital and evidence of self-funded growth. With beta at 0.86 and a 52-week performance close to the S&P 500, ENB has traded like a bond-proxy income name with selective growth optionality. A benign rate path and steady project cadence could nudge the multiple toward the high end of midstream peers, particularly if dividend coverage tightens on an internally funded basis. Conversely, higher-for-longer rates or setbacks in permitting would likely cap multiple expansion and keep the stock range-bound. Over the next three years, the narrative that earns a premium will be one of visible deleveraging, predictable organic growth, and clean execution—factors investors will track quarter by quarter.
What could happen in three years? (horizon October 2025+3)
| Scenario | Narrative |
|---|---|
| Best | Interest rates ease and credit spreads tighten, enabling low-cost refinancing. Major projects reach service on time and on budget, bolstering contracted cash flows. Regulatory outcomes are constructive, FX is neutral-to-supportive, and disciplined capex plus selective asset recycling drive visible deleveraging. Dividend growth resumes at a measured pace and the equity rerates within the sector. |
| Base | Rates remain range-bound and execution is steady. Projects enter service with minor schedule variance, providing incremental EBITDA that largely offsets inflation and funding costs. Dividend policy is conservative, with modest growth supported by stable coverage. Valuation tracks sector averages, moving with bond yields and project milestones. |
| Worse | Higher-for-longer rates and sticky credit spreads inflate interest expense. Permitting or legal challenges delay projects and elevate costs; a safety or environmental incident adds scrutiny. FX turns adverse. Management prioritizes balance sheet stability, slowing capex and pausing dividend growth; equity issuance or asset sales become necessary, compressing the multiple. |
Projected scenarios are based on current trends and may vary based on market conditions.
Factors most likely to influence the share price
- Refinancing conditions and the interest-rate path affecting the cost of 101.13B in total debt.
- Permitting, regulatory rulings, and rate cases that determine project timing and allowed returns.
- Execution on capital projects and integration of regulated assets, driving cash flow and capex outlays.
- Throughput volumes and commodity-linked spreads that influence incentive tolls and storage utilization.
- FX (USD/CAD) and inflation dynamics that affect translated results and tariff escalators.
- Portfolio actions (asset sales, M&A) that impact deleveraging, dividend coverage, and capital allocation.
Conclusion
Enbridge’s setup into 2026–2028 is a tug-of-war between rising, contract-backed cash flows and the realities of a large balance sheet. The financial snapshot shows healthy revenue momentum, durable margins, and scale-level EBITDA, but also a funding equation where operating cash flow must finance capex, interest, and a sizable dividend. That leaves the equity story acutely sensitive to execution and the cost of capital. Sector context is constructive—North American gas and liquids corridors remain essential—yet regulatory timelines and FX can blur year-to-year visibility. The equity narrative improves as free cash flow after dividends becomes consistently positive and deleveraging is evident. Watch next 1–2 quarters: project in-service milestones; regulatory filings and permits; refinancing progress and spreads; dividend coverage signals; FX translation. If ENB converts backlog into on-time, on-budget assets while holding funding costs in check, the next three years could steadily pivot from balance sheet debate to growth-and-income durability.
This article is not investment advice. Investing in stocks carries risks and you should conduct your own research before making any financial decisions.