
Johnson & Johnson enters the next three years with a steadier footing: investors have re‑rated the shares as growth reaccelerated and profitability held up in core prescription drugs and medical devices. The company reported trailing revenue of 92.15B and returned to mid‑single‑digit sales growth as procedure volumes normalized and recent launches matured. The shift reflects a more focused mix and disciplined cost control, which helped sentiment even as macro headlines stayed noisy. This matters because JNJ’s appeal is the combination of defensive cash flows and selective innovation; if that balance holds, earnings quality should remain high and the dividend reliable. Sector‑wide, large‑cap biopharma and medtech face patent expiries, reimbursement scrutiny, and stronger competition from biosimilars; leaders are leaning on pipelines, tuck‑in deals, and productivity to bridge gaps. Looking ahead, the debate is about the sustainability of volume‑led growth versus price pressure, the cadence of regulatory approvals, and any lingering legal overhangs. Because expectations have risen, consistency in execution will likely drive the multiple.
Key Points as of October 2025
- Revenue – Trailing 12‑month revenue is 92.15B; most recent quarter’s revenue grew 6.80% year over year.
- Profit/Margins – Profit margin is 27.26% with operating margin at 30.20%; gross profit totals 62.99B.
- Earnings momentum – Quarterly earnings growth (yoy) is 91.20%; sustainability depends on mix and potential prior‑year comparisons.
- Cash flow & dividends – Operating cash flow is 24.2B and levered free cash flow 12.01B; forward annual dividend rate 5.2 implies a 2.78% yield, with a 49.08% payout; next ex‑dividend is 11/25/2025 and dividend date is 12/9/2025.
- Balance sheet & liquidity – Total cash 18.56B against total debt 45.8B; current ratio 1.07; total debt/equity 57.77%.
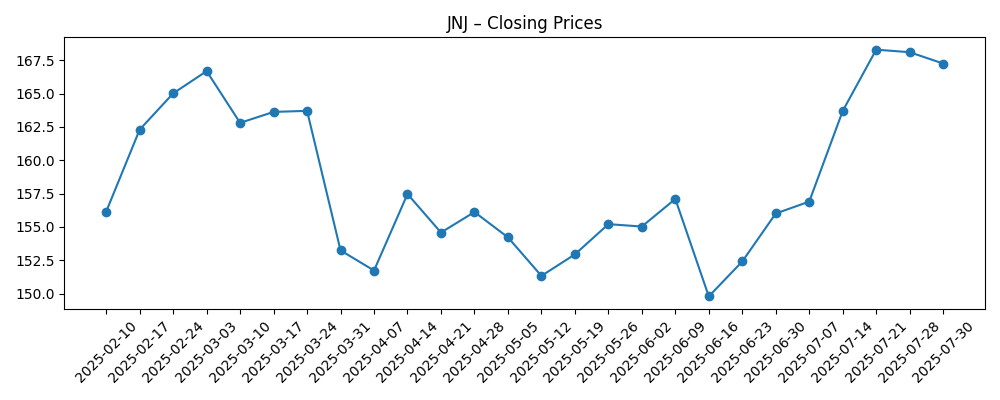
- Share price & trading – 52‑week high 194.48 and low 140.68; 50‑day moving average 182.96 vs 200‑day 164.34; 52‑week change 16.73%; beta 0.39.
- Ownership & sentiment – Institutions hold 74.33%; short interest is 0.86% of float (short ratio 2.25), indicating limited directional bets.
- Market cap & float – Market capitalization not disclosed here; shares outstanding 2.41B and float 2.41B; average 3‑month volume 8.53M supports liquidity.
- Qualitative – Diversified pharma and medtech mix; FX (foreign exchange), reimbursement policy, competition from generics/biosimilars, and litigation are key variables.
Share price evolution – last 12 months
Notable headlines
Opinion
JNJ’s recent prints point to a return to steady growth with resilient profitability. Revenue growth in the latest quarter accelerated to the mid‑single‑digit range, which, alongside a 30.20% operating margin and 27.26% net margin, suggests disciplined cost execution and a healthier product mix. The outsized 91.20% year‑over‑year earnings growth likely reflects comparison effects and mix rather than a step‑change in underlying demand, so investors should look through to recurring elements: procedure normalization in medtech, maturing launches in pharma, and operating leverage as volumes scale. Because these drivers are more volume‑than price‑led, they are sensitive to macro and payer dynamics.
Cash generation remains a strategic anchor. Operating cash flow of 24.2B and levered free cash flow of 12.01B support a 49.08% payout ratio and a forward dividend yield of 2.78%. Liquidity looks adequate with a 1.07 current ratio, while leverage (45.8B total debt versus 18.56B cash) is manageable against cash flows. Low beta at 0.39 underscores the defensive profile, but it also means rerating depends on a credible path to durable growth. Near term, expect capital deployment to favor the dividend and selective R&D and tuck‑ins; larger actions likely hinge on legal clarity.
Within healthcare, pricing power is being tested by reimbursement scrutiny and biosimilar competition, while medtech benefits from procedure recovery and innovation cycles. JNJ’s scale, breadth, and global footprint help balance these forces, yet FX and policy shifts can still move the needle. The company’s narrative over the next three years will be shaped by the cadence of clinical/regulatory milestones and the ability to refresh growth in key franchises without sacrificing margins.
Valuation inputs are not provided here, but the setup implies a tug‑of‑war between dependable income and the market’s demand for growth evidence. If pipeline and product cycle execution steadily replenish revenue while margins hold near current levels, the multiple can be supported. Conversely, any stumbles on approvals, safety, or payer access would likely compress sentiment, particularly after shares approached their 52‑week high and key moving averages have trended higher. In short, the stock’s path will track the credibility of growth and the resolution of known overhangs.
What could happen in three years? (horizon October 2028)
| Best case | Multiple late‑stage assets secure approvals and scale, medtech launches gain share, and productivity initiatives offset inflation. Growth runs above industry, margins hold, and legal uncertainties diminish. The story tilts back toward a quality growth compounder with steady dividend increases. |
|---|---|
| Base case | Steady low‑ to mid‑single‑digit growth as established products fund selective launches; medtech normalizes; FX and pricing are manageable headwinds. Margins are broadly stable, and dividend growth tracks earnings. Narrative remains “durable cash flows plus measured innovation.” |
| Worse case | Patent erosion and tougher reimbursement outpace new launches, while litigation setbacks and FX pressure weigh on cash flow. Margins compress and capital returns become more conservative as management prioritizes balance sheet resilience. |
Projected scenarios are based on current trends and may vary based on market conditions.
Factors most likely to influence the share price
- Regulatory and clinical milestones for key pipeline assets (approvals, label expansions, or setbacks).
- Pricing and reimbursement trends across major markets, including payer formulary decisions and procedure volumes.
- Litigation developments and any settlements that affect cash flow visibility.
- FX swings and macro conditions that influence international revenue translation and input costs.
- Supply chain and manufacturing execution affecting product availability and gross margin mix.
- M&A and portfolio actions (tuck‑in deals or divestitures) and their integration outcomes.
Conclusion
JNJ’s investment case into 2028 balances dependable cash generation with the need to periodically refresh growth. The latest data show improving top‑line momentum and robust margins, backed by 24.2B in operating cash flow and an investor‑friendly payout policy. That combination anchors downside, but upside requires consistent execution in pharma launches and medtech innovation amid payer pressure and biosimilar competition. Ownership remains institutionally heavy and short interest is low, which supports stability but also sets a bar for news flow to drive the next leg. With shares tracking near long‑term averages and volatility muted by a 0.39 beta, catalysts will likely come from clinical, regulatory, and legal clarity rather than macro alone. Watch next 1–2 quarters: pipeline readouts and regulatory decisions; pricing and reimbursement trends; medtech procedure volumes; FX translation impact; margin mix and operating discipline; any litigation developments affecting cash flow.
This article is not investment advice. Investing in stocks carries risks and you should conduct your own research before making any financial decisions.