
LG Energy Solution’s share price has climbed back toward its yearly peak, closing at KRW 438,500 on October 21, as management signaled steadier orders and continued progress on US capacity ramp‑up. The company remains a scale leader with trailing revenue of 25.16T, but profitability is thin as customer price resets and new‑plant start‑up costs weigh on margins. Recent updates — including extended supply agreements with global automakers and renewed staffing for US facilities — suggest improving utilization and policy visibility, yet cash outlays remain heavy as the firm localizes production for North American incentives. For investors, the pivot from volume growth to disciplined, cash‑generative growth will be the key swing factor over the next three years. In the battery sector, adoption is moving forward even as the broader auto market cools, keeping competition intense and technology choices (LFP vs. high‑nickel) fluid. The base case is a gradual margin rebuild as ramps mature, but the pace will depend on product mix, raw‑material trends, and subsidy qualification.
Key Points as of October 2025
- Revenue: trailing twelve‑month (ttm) revenue of 25.16T; quarterly revenue growth (yoy) at -9.70%, reflecting inventory normalization and mix shifts at major auto customers.
- Profit/Margins: ttm profit margin -3.93% and operating margin 0.03%; ttm net income to common is negative; gross profit 3.8T and EBITDA 3.94T signal scale but thin contribution.
- Sales/Backlog: Backlog not disclosed; visibility supported by recent supply agreements with global OEMs and company commentary that Q2 2025 demand increased.
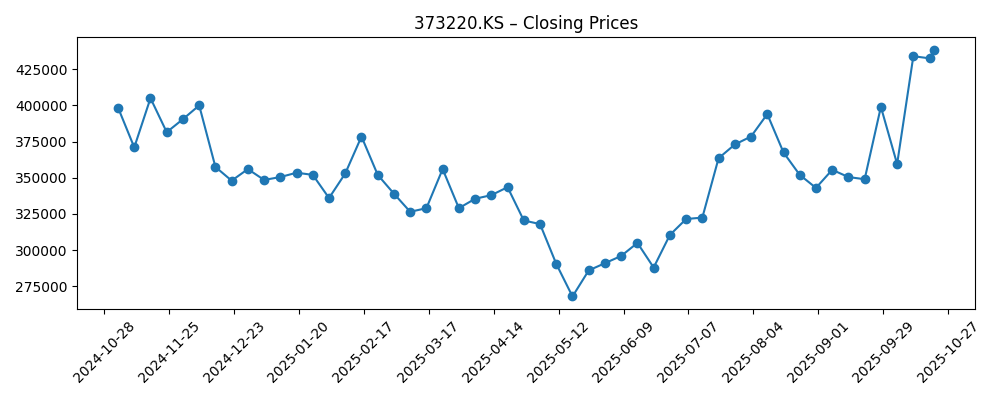
- Share price: KRW 438,500 (Oct 21), up 11.42% over 52 weeks; near the 52‑week high of 443,000; 50‑day moving average 369,900; beta 0.94; trading volumes have risen vs. 3‑month average.
- Analyst view: Street ratings/targets not disclosed; debate centers on margin recovery pace, US plant execution, and mix between LFP and high‑nickel chemistries.
- Market cap/Ownership: Market cap not stated here; implied large‑cap given 234M shares and recent price; ownership concentrated with insiders at 82.31% and institutions at 10.39%; float 41.41M.
- Balance sheet & liquidity: Total cash 5.44T; total debt 20.86T (debt/equity 73.70%); current ratio 1.21; operating cash flow 5.16T vs. levered free cash flow -5.99T indicates capex‑heavy phase.
- Qualitative: US localization and subsidy eligibility (IRA content rules) drive cost and staffing; company is sending Korean battery workers back to US plants; competitive pressure from global peers keeps pricing tight.
Share price evolution – last 12 months
Notable headlines
- LG Energy Solution's Q2 2025 Results Show Increased Battery Demand
- Tesla Extends Battery Supply Agreement with LG Energy Solution
- LG Energy Solution Announces $1 Billion Investment in US Battery Plant
- LG Energy Solution to Provide Batteries for Ford's Next-Gen EVs
- LG Energy to Start Sending Korean Battery Workers Back to the US
- South Korea's LG Energy Solution Eyes China Expansion Amid Rising Local Demand
- Hyundai Taps LG Energy Solution for Ioniq 7 Battery Supply
Opinion
Results paint a company in transition. Trailing revenue of 25.16T underscores durable scale, yet quarterly revenue growth at -9.70% shows that customers continued rebalancing inventories and reshaping model mix. Operating profitability is essentially flat at 0.03% while the profit margin is negative, consistent with a ramp where utilization is not yet optimal and pricing resets at large OEMs take time to flow through. Raw‑material passthrough mechanisms can also compress realized prices when lithium and nickel deflate. The share recovery toward the 52‑week high looks more like an anticipation of improved visibility than confirmation of a full earnings inflection. In short, orders appear healthier, but sustained margin repair still has to be demonstrated in reported results.
Cash generation shows the same split between promise and proof. Operating cash flow of 5.16T is solid for a ramp year, but levered free cash flow at -5.99T and a current ratio of 1.21 highlight the burden of capacity build‑out and working capital. Debt of 20.86T is manageable relative to scale, yet it narrows room for error if volumes disappoint. The move to send Korean battery workers back to US plants suggests supply chain normalization and progress on domestic content qualification, which should improve utilization and learning‑curve costs. The quality of any near‑term “beat” will hinge less on headline revenue and more on contribution margin per gigawatt‑hour, capex cadence, and the speed of US subsidy capture.
Within the industry, pricing power remains contested as global rivals target share and OEMs prioritize affordability. Technology mix is pivotal: LFP cells support cost competitiveness and resilience to nickel volatility, while high‑nickel chemistries underpin performance models; winning the right mix by region will shape yields and factory loadings. Policy is a second key axis. US domestic‑content rules pull production onshore and can lift unit economics once thresholds are met, but they also front‑load costs. Europe’s demand trajectory and any adjustments to trade or subsidy frameworks will influence where new capacity is justified and how aggressively the company bids for programs.
These cross‑currents inform the multiple and narrative over the next three years. A credible path to positive, durable free cash flow and a cleaner margin run‑rate would support a higher quality of earnings and potentially a richer multiple. Conversely, a prolonged price war, slower EV adoption, or delays in US plant ramps could leave the story anchored to volume growth with limited value creation. Contract wins with marquee OEMs extend visibility, but investors will likely prioritize proof points: backlog conversion into revenue without dilution of margins, sequential improvement in operating leverage, and evidence that capital intensity is peaking. Delivery on these metrics would shift the narrative from “scale with thin returns” to “scaled returns.”
What could happen in three years? (horizon October 2025+3)
| Scenario | Narrative |
|---|---|
| Best | US plants reach stable, high utilization with domestic‑content qualification, converting recent contracts into steady volumes. Mix optimization across LFP and high‑nickel improves unit economics, turning operating momentum into sustained positive free cash flow. The company strengthens its strategic positioning with diversified customers across North America, Europe, and Asia. |
| Base | Ramps mature gradually and margins improve, but pricing remains competitive. Cash generation is choppy as capex rolls off unevenly. Contracts provide visibility, and profitability normalizes, yet valuation remains sensitive to policy timelines and customer launch schedules. |
| Worse | EV adoption underwhelms in key markets or a price war intensifies. Factory utilization stays suboptimal, subsidy capture is delayed, and working‑capital needs persist. Profitability remains constrained and the narrative reverts to capacity absorption and balance‑sheet resilience. |
Projected scenarios are based on current trends and may vary based on market conditions.
Factors most likely to influence the share price
- Execution of US factory ramps and timing of subsidy/content qualification under local rules.
- Customer program launches and volumes at major OEM partners, including any shifts in model mix or timelines.
- Battery pricing dynamics versus raw‑material trends (lithium, nickel) and the effectiveness of passthrough mechanisms.
- Capital intensity and cash conversion — trajectory from positive operating cash flow toward sustained free cash flow.
- Competitive responses from global cell makers and any trade or regulatory changes in North America, Europe, or China.
Conclusion
LG Energy Solution enters its next three‑year cycle with restored share momentum and clearer order visibility but still‑fragile profitability. Scale is intact and the book of business appears to be expanding, yet the financial profile shows a ramp‑heavy mix: modest operating profit, negative net income, positive operating cash flow offset by capex and working‑capital needs. The investment narrative can improve as US capacity stabilizes, domestic‑content rules are met, and product mix aligns with customer affordability goals. That would lift utilization and contribution margins, easing balance‑sheet strain. Conversely, slower EV uptake or aggressive pricing could elongate the recovery path. Watch next 1–2 quarters: backlog conversion at new plants; pricing and chemistry mix; operating cash flow versus capex; timeline and costs of US localization; customer launch milestones in North America and Europe. Evidence of operating leverage and capex moderation would mark the transition from a volume‑to‑value story and determine how the market values this cycle.
This article is not investment advice. Investing in stocks carries risks and you should conduct your own research before making any financial decisions.