
Suncor Energy enters late 2025 with steadier operations after a volatile first half, but with softer year‑over‑year growth as commodity and refining cycles normalized. Trailing twelve‑month revenue is 49.73B, reflecting lower realized prices and typical maintenance effects earlier this year. The company’s integrated model—oil sands production paired with refining and marketing—helps cushion swings, yet the mix still leans on upstream price exposure and downstream crack spreads (refining margins). Canada’s energy sector remains focused on capital discipline, operational reliability, and shareholder returns after a decade of boom‑bust cycles. For investors, the three‑year question is whether Suncor can convert reliability gains and cost control into consistent free cash flow that sustains its forward dividend yield of 4.08% while keeping balance sheet flexibility. That trade‑off will be shaped by crude benchmarks, Canadian policy on carbon and permits, and the pace of global demand as petrochemical and aviation recovery gradually mature. In short, near‑term stability sets the stage, but the durability of cash returns through the next cycle is the core investment test.
Key Points as of November 2025
- Revenue: trailing twelve‑month revenue of 49.73B; latest quarter showed year‑over‑year revenue decline of -7.00%.
- Profit/Margins: profit margin 11.38%; operating margin 10.65%; net income (ttm) 5.66B; diluted EPS (ttm) 4.54.
- Cash generation: operating cash flow (ttm) 14.42B; levered free cash flow (ttm) 7.23B, supporting ongoing shareholder returns.
- Balance sheet: total debt 14.28B; debt/equity 32.03%; current ratio 1.26; total cash 2.27B.
- Dividends: forward annual dividend yield 4.08% on a 2.28/share rate; payout ratio 49.67%; last dividend paid 9/25/2025 (ex‑date 9/4/2025).
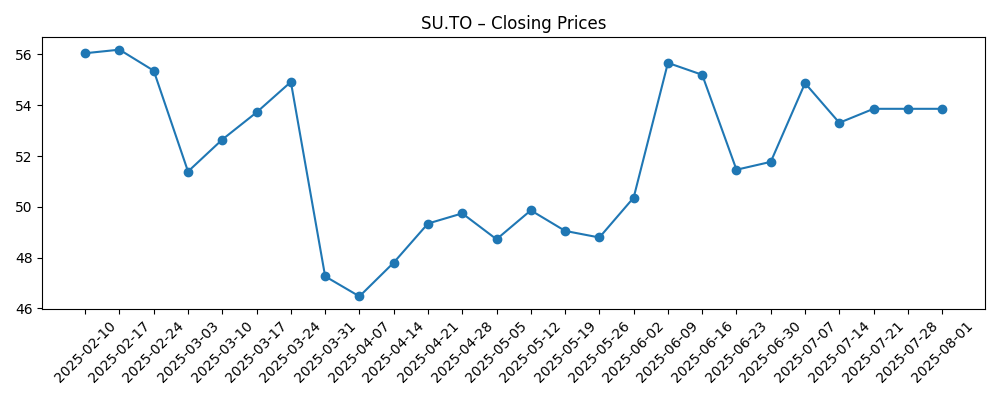
- Share price: 52‑week range 43.59–60.48; 50‑day MA 56.66 vs. 200‑day MA 53.58; 52‑week change +5.20%; beta (5Y) 1.15.
- Market cap: large‑cap profile; exact market capitalization not disclosed here; shares outstanding 1.21B.
- Analyst view: external rating/target details not provided in this dataset; investor focus remains on reliability and cash returns.
- Sales/Backlog & mix: no formal backlog metric; performance tied to commodity prices, refinery utilization, and product mix; regulatory and carbon‑cost exposure in Canada remains an overhang.
Share price evolution – last 12 months
Notable headlines
Opinion
Suncor’s recent prints show the classic pattern of an integrated energy company transitioning from a high‑price environment to a more normalized cycle: revenue and earnings decelerated year over year as crude benchmarks eased and refining margins came off peaks. Yet the quality of cash generation remains notable, with strong operating cash flow and a near‑half payout ratio that still leaves room for balance sheet management. Because Suncor is integrated, downstream can partly offset upstream softness; that cushioning appears to have worked, even as quarterly revenue growth turned negative. The three‑year issue is less about one quarter and more about sustaining free cash flow through reliability and cost control.
Put differently, the “beat/miss” cadence matters less than whether unplanned downtime fades and unit costs track flat to down despite inflation in labor and maintenance. If reliability initiatives keep throughput high and refining utilization steady, cash conversion can stay healthy even in a mid‑cycle price band. Conversely, a few unexpected outages could erase the buffer, particularly if crack spreads compress at the same time. The dividend looks supportable given current cash flows, but future growth will likely be paced by commodity conditions and operational delivery rather than aggressive target setting.
Within the sector, Canadian integrated names tend to trade on two narratives: capital returns and operating reliability. Suncor’s integrated footprint provides optionality across upstream and downstream, but also exposes it to regulatory and carbon‑cost trends that can influence sustaining capital and netbacks. If policy clarity improves and logistics constraints ease, Suncor could expand margins through debottlenecking and refining optimization. That would support a steadier multiple as investors price in lower variance of outcomes, particularly if free cash flow coverage of dividends remains ample.
On the other hand, a shifting demand mix—especially from petrochemicals and aviation—plus evolving climate policy creates an uneven backdrop. If global growth slows and crack spreads normalize further, the market could emphasize downside protection over growth, keeping the multiple anchored. In that setting, the story tilts toward disciplined buybacks and a measured dividend glide path, rather than volume growth. Over three years, narrative stability will likely hinge on evidence of consistent uptime, modest cost deflation, and balanced capital allocation, which together could reduce perceived risk and narrow the discount to broader energy peers.
What could happen in three years? (horizon November 2025+3)
| Scenario | Narrative |
|---|---|
| Best case | Oil prices hold in a mid‑cycle band, reliability improves, and refining utilization stays high. Cost discipline sustains strong free cash flow, enabling steady dividend growth and opportunistic buybacks. Policy clarity on carbon costs reduces uncertainty and supports a modest rerating. |
| Base case | Range‑bound commodities and normal refinery margins. Operations are broadly stable with occasional maintenance headwinds. Free cash flow comfortably covers dividends and some buybacks, while balance sheet metrics remain steady. Valuation tracks sector averages. |
| Worse case | A downturn compresses crude prices and crack spreads simultaneously, while outages drive higher unit costs. Cash generation tightens; management prioritizes maintenance capex and balance sheet over buybacks. The equity multiple de‑rates until reliability and margins recover. |
Projected scenarios are based on current trends and may vary based on market conditions.
Factors most likely to influence the share price
- Global crude benchmarks and refining crack spreads, which drive realized prices and downstream margins.
- Operational reliability across oil sands and refineries, including maintenance timing and unplanned downtime.
- Canadian regulatory and carbon‑pricing policy that affects sustaining capital and cost structure.
- Capital allocation between dividends, buybacks, and debt reduction, given free cash flow variability.
- Pipeline and logistics constraints that influence differentials and market access for Canadian barrels.
- M&A or asset sales that alter the production mix, cost base, or balance sheet flexibility.
Conclusion
Suncor’s setup into 2028 is a balance of solid cash generation and familiar cycle risks. Trailing profitability and cash flow indicate the dividend is well covered today, while leverage appears manageable, giving the company room to keep returning capital if operations stay reliable. The integrated model remains a strategic cushion: downstream can offset upstream softness, though that buffer weakens when crude and crack spreads fall together. Policy clarity and logistics will likely shape cost trajectories and netbacks for Canadian producers, and therefore the equity narrative. Watch next 1–2 quarters: reliability and downtime trends; downstream margin capture; cash flow coverage of the dividend; capital allocation between buybacks and debt; regulatory developments that could affect sustaining costs. If Suncor delivers steady uptime and disciplined spending, investors may reward the lower volatility of outcomes; if not, the multiple may remain tethered to the commodity tape.
This article is not investment advice. Investing in stocks carries risks and you should conduct your own research before making any financial decisions.