
Allianz shares have pushed higher in recent months as profitability improved and the dividend signal held firm. What changed: earnings momentum re‑accelerated while revenue growth was flat, pointing to better underwriting discipline and higher investment income as rate effects filter through fixed‑income portfolios. Why it changed: a healthier mix of insurance, asset management and investment returns supported return on equity of 18.18%, with cash generation cushioning volatility from weather and markets. Why it matters: in European insurance, the cycle is shifting from pure rate tailwinds to execution—pricing, claims control, and fee resilience—while investors refocus on sustainable capital returns. With a global footprint, scale, and a 4.17% dividend yield, Allianz sits at the center of the sector’s transition from “rates‑led” to “operations‑led” narratives. The next leg depends on how quickly reinvestment yields normalize, whether catastrophe losses remain manageable, and if fee income from asset management steadies alongside markets. The setup rewards clarity on capital allocation and underwriting quality over headline growth.
Key Points as of October 2025
- Revenue: trailing twelve‑month revenue of 109.02B; revenue per share 282.58.
- Profit/Margins: profit margin 9.36% and operating margin 11.05%; return on equity 18.18% underscores efficient capital use.
- Sales/Backlog: most recent quarterly revenue growth was flat year over year; backlog not applicable in insurance.
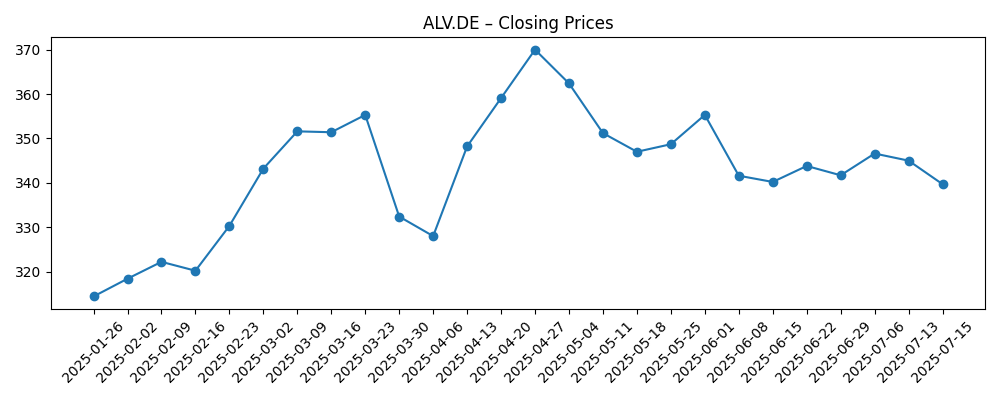
- Share price: last weekly close around 366.10; trades above the 50‑day (360.42) and 200‑day (344.43) moving averages; 52‑week range 281.80–380.30.
- Analyst view: formal ratings not provided in the data; sentiment appears constructive with a 22.74% 12‑month change and beta of 0.95.
- Market cap: not disclosed in the provided figures; Allianz remains among Europe’s largest insurers by float and revenue.
- Cash & leverage: total cash 132.17B versus total debt 36.88B; debt‑to‑equity 60.95%; current ratio 1.63.
- Cash flow: operating cash flow 36.77B and levered free cash flow 4.99B support investment and distributions.
- Dividend: forward annual dividend rate 15.4 with a 4.17% yield; payout ratio 59.05% implies headroom but requires steady earnings.
Share price evolution – last 12 months
Notable headlines
Opinion
Allianz’s recent performance looks driven more by earnings quality than by top‑line expansion. Revenue was flat, yet quarterly earnings growth improved, suggesting underwriting profitability and investment income did the heavy lifting. In a high‑but‑plateauing rate environment, insurers benefit as maturing bonds are reinvested at better yields; that tailwind is gradual and tends to persist for several periods. Profit margin of 9.36% and operating margin of 11.05% align with this narrative, while 18.18% ROE indicates solid capital deployment across insurance and fee businesses. The cash flow profile—36.77B in operating cash flow versus 4.99B in levered free cash flow—also signals capacity to fund claims, invest, and maintain distributions.
How durable is this? The dividend looks supported by a 59.05% payout ratio and balanced cash generation, but resilience hinges on claims inflation and catastrophe experience. Flat revenue growth implies Allianz may be prioritizing pricing and risk selection over volume—sensible late in the rate cycle. The investment line remains sensitive to the path of yields; rapid declines would compress reinvestment returns, while stable curves should extend the current margin setup. Asset management fees will track market levels; constructive markets help the group’s earnings mix, but volatility is an inherent swing factor.
Within the industry, the narrative is shifting from rate‑beta to execution. Pricing power in P&C depends on reinsurance costs and competitive intensity; disciplined renewals can protect margins even if volumes are modest. Digital claims handling and distribution can shave expense ratios over time, improving through‑cycle earnings without requiring aggressive growth. Regulatory capital under Solvency II remains a key constraint and opportunity—capital efficiency, product mix, and duration management will influence how much can be returned to shareholders versus reinvested (specific ratios were not disclosed in the provided data).
These dynamics will shape valuation. A lower beta (0.95) and a reliable dividend (4.17% yield) can support a steadier multiple if investors gain confidence in underwriting consistency and fee resilience. Conversely, any uptick in large losses or a sharp fall in bond yields could challenge the margin story and pressure the multiple. Over 2026–2028, the company’s ability to convert operating cash into free cash after growth investments—while keeping payout discipline—will likely define whether the stock sustains a premium within European insurance peers.
What could happen in three years? (horizon October 2025+3)
| Scenario | Narrative |
|---|---|
| Best | Rates settle higher‑for‑longer, underwriting remains disciplined, catastrophe losses are manageable, and asset management sees steady inflows. Margins hold or improve as expense ratios edge down via digital and analytics. Dividend growth is consistent, reinforcing a quality compounder narrative. |
| Base | Gradual rate cuts modestly reduce reinvestment yields, but pricing and claims control offset. Market levels are choppy yet supportive enough for stable fees. Earnings grow in line with cost efficiency, sustaining the dividend and a stable valuation multiple. |
| Worse | Rapid rate declines compress investment income, while elevated catastrophe activity and competitive pricing erode underwriting results. Market drawdowns weigh on fee income. Cash generation tightens, forcing a more conservative capital return stance and a lower multiple. |
Projected scenarios are based on current trends and may vary based on market conditions.
Factors most likely to influence the share price
- Magnitude and pace of interest‑rate moves affecting reinvestment yields and investment income.
- Underwriting cycle outcomes: pricing discipline, claims inflation, and catastrophe losses relative to reinsurance costs.
- Equity and credit market performance driving asset‑management fees and mark‑to‑market effects.
- Regulatory and capital developments under Solvency II impacting capital returns and product mix.
- Execution on expense reduction and digital claims handling influencing margins and cash conversion.
- Potential portfolio actions or M&A altering risk profile and earnings mix.
Conclusion
Allianz enters the next three years with improved profitability, solid cash generation, and a dividend that aligns with a disciplined payout framework. The mix of underwriting and investment income has carried results while revenue growth stayed flat, consistent with late‑cycle insurance dynamics where execution outruns volume. With the share price trading above key moving averages and volatility muted by a sub‑1 beta, the multiple should hinge on whether management can defend margins as rates plateau and fee income tracks markets. The operating and financial data suggest capacity to invest in efficiency while sustaining distributions, but sensitivity to catastrophe losses and the yield curve remains the central swing factor. Watch next 1–2 quarters: underwriting pricing versus claims inflation; reinvestment yields and investment income trend; asset‑management fee resilience; expense ratio progress and cash conversion. Clear communication on capital allocation and risk appetite could keep the narrative focused on quality and durability rather than cyclical beta.
This article is not investment advice. Investing in stocks carries risks and you should conduct your own research before making any financial decisions.