
Credicorp Ltd. (BAP) has staged a powerful rally in 2025, climbing to within sight of its 52‑week high as margins and top‑line growth accelerated. As of September 2025, the Peru‑focused financial group reports revenue (ttm) of $19.74B and net income of $6.25B, supported by a 49.90% operating margin and 31.66% profit margin. Quarterly revenue and earnings growth clocked 23.90% and 36.10% year‑over‑year, while return on equity stands at 18.78%. The stock is up 50.09% over 12 months and trades well above its 50‑ and 200‑day moving averages. Institutional positioning has been active in recent weeks, with several holders adjusting stakes. This three‑year outlook assesses what the latest fundamentals, dividends, and flow of investor interest could mean for BAP’s valuation and share price trajectory.
Key Points as of September 2025
- Revenue: ttm revenue is $19.74B; quarterly revenue growth (yoy) is 23.90%.
- Profit/Margins: Profit margin 31.66%; operating margin 49.90%; ROE 18.78%; ROA 2.57%.
- Sales/Backlog: Banking “pipeline” is credit and fee demand; no backlog disclosed. Gross profit (ttm) is $19.58B.
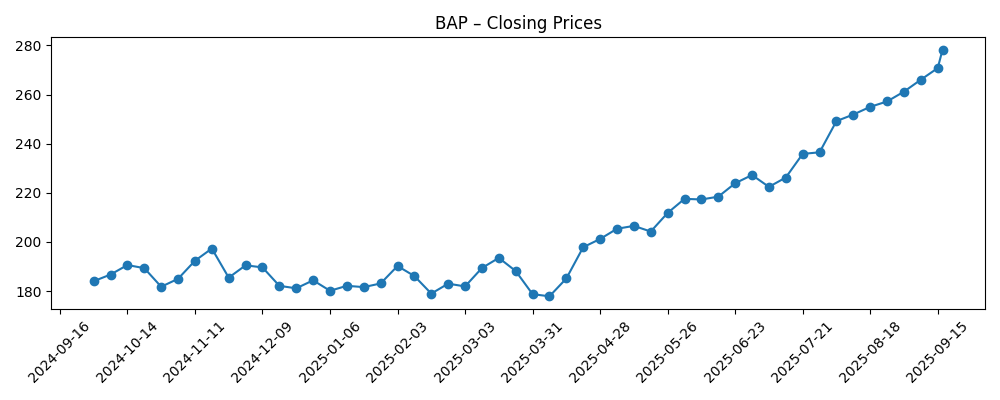
- Share price: Up 50.09% over 12 months; 52‑week range 165.51–280.88; recent weekly close 278.29 (Sep 17). 50‑day MA 245.38; 200‑day MA 206.82; beta 1.09.
- Dividend: Forward annual dividend rate $11.01 (4.07% yield); trailing $40.00 (14.77% yield); payout ratio 52.36%. Dividend paid 6/13/2025; ex‑div 5/19/2025.
- Balance sheet & cash flows: Total cash $35.46B; total debt $24.97B; operating cash flow (ttm) $7.54B.
- Market cap: Implied approximately $21.5–22.1B based on 79.37M shares and $270.79–$278.29 recent prices.
- Ownership & trading: Institutions hold 78.27%; insiders 16.21%. Short interest is 1.19% of float; short ratio 2.19; 3‑month average volume 339.15k.
- Analyst view: No specific estimates provided; sentiment hinges on sustaining growth and credit quality as shares hover near highs.
Share price evolution – last 12 months
Notable headlines
- Northern Trust Corp Grows Position in Credicorp Ltd. $BAP
- Goldman Sachs Group Inc. Raises Position in Credicorp Ltd. $BAP
- Wellington Management Group LLP Sells 63,403 Shares of Credicorp Ltd. $BAP
- Credicorp Ltd. $BAP Stock Holdings Lowered by Smartleaf Asset Management LLC
- Swedbank AB Reduces Stock Position in Credicorp Ltd. $BAP
- Advisors Asset Management Inc. Purchases Shares of 474 Credicorp Ltd. $BAP
- Rhumbline Advisers Has $2.95 Million Stock Position in Credicorp Ltd. $BAP
- Corebridge Financial Inc. Sells 100 Shares of Credicorp Ltd. $BAP
Opinion
Credicorp’s three‑year setup looks balanced between strengthening fundamentals and the realities of a late‑cycle credit backdrop. The company enters this period with notable momentum: ttm revenue of $19.74B, net income of $6.25B, and year‑over‑year growth of 23.90% (revenue) and 36.10% (earnings). Profitability metrics remain robust, with operating margin at 49.90% and ROE at 18.78%. With shares up 50.09% in the past year and trading near the 52‑week high of 280.88, investor expectations have clearly risen. The next leg of performance will likely hinge on whether growth can normalize at a healthy level without a sharp credit‑cost upturn. Given the 50‑ and 200‑day moving averages at 245.38 and 206.82, respectively, the technical backdrop remains constructive, but sensitivity to macro headlines could elevate volatility from here.
Income appeal is a central part of the equity story. The forward annual dividend rate of $11.01 (4.07% yield) sits alongside a trailing $40.00 (14.77% yield), reflecting a variable distribution policy and strong recent earnings. A 52.36% payout ratio aligns with a prudently balanced approach given a financial institution’s capital needs. Backing this, operating cash flow (ttm) of $7.54B and a cash‑to‑debt profile of $35.46B vs. $24.97B indicate financial flexibility, even as headline figures for banks should be interpreted within regulatory capital frameworks. Over a three‑year horizon, investors will watch whether dividends remain stable or grow in line with earnings. If ROE holds in the high‑teens and profitability stays resilient, the dividend could act as both a floor for the stock and a signal of confidence in medium‑term earnings power.
Flows and positioning are supportive but mixed, consistent with a market consolidating near highs. Recent headlines show some large holders increasing exposure (e.g., Northern Trust, Goldman Sachs), while others trimmed or rebalanced (Wellington, Swedbank, Smartleaf). With 78.27% held by institutions and 16.21% by insiders, ownership is deep, and short interest is modest at 1.19% of float (short ratio 2.19). That setup typically reduces downside driven by forced covering but can dampen incremental demand if buy‑side portfolios are already close to target weights. Liquidity appears adequate given average volumes, and the beta of 1.09 suggests market‑like sensitivity. Over the next three years, steady institutional sponsorship and low short positioning could underpin the share price, provided earnings delivery persists and macro conditions in core markets remain orderly.
Valuation is the open question. Without detailed consensus estimates here, the simplest anchor is the company’s own delivery: strong margins, high‑teens ROE, and accelerating growth in the most recent comparisons. If growth normalizes from a high base but remains positive, multiple compression may be limited; conversely, a turn in credit trends or regulatory tightening could pressure both growth and valuation. Technically, the stock’s climb from roughly the high‑$170s to the high‑$270s in six months, alongside rising moving averages, indicates improving trend quality. Over a three‑year window, the path of least resistance favors tracking earnings and dividends, with the potential for periodic volatility around macro events. A prudent stance recognizes the strength of current metrics while allowing for cyclical mean reversion.
What could happen in three years? (horizon September 2025+3)
| Scenario | Operations | Capital & Dividends | Valuation & Stock Implication |
|---|---|---|---|
| Best | Revenue growth remains healthy; margins stay strong near recent levels; ROE sustains around the high‑teens with stable asset quality. | Payout policy remains disciplined; dividends grow in line with earnings while maintaining flexibility. | Premium relative valuation persists; shares hold above prior peak zones and compound with earnings. |
| Base | Growth normalizes from recent highs; profitability remains resilient despite modest credit‑cost normalization. | Dividend broadly stable; occasional variability around annual results and capital needs. | Stock tracks earnings and dividend progress, oscillating around long‑term trend levels. |
| Worse | Macro softness and higher credit costs pressure growth; profitability narrows from current margins. | Dividend policy turns more conservative to prioritize capital; growth in payouts pauses. | Valuation de‑rates; shares revisit major support areas such as long‑term moving averages or prior low zones. |
Projected scenarios are based on current trends and may vary based on market conditions.
Factors most likely to influence the share price
- Credit quality and loan‑loss trends across core markets; any spike could pressure earnings and valuation.
- Regulatory or capital framework changes affecting payout capacity and growth initiatives.
- Macroeconomic conditions and currency volatility in operating geographies, impacting demand and risk costs.
- Sustained revenue momentum vs. normalization after recent 23.90% growth and 36.10% earnings growth comps.
- Institutional flows and liquidity, including shifts by major holders and overall short interest.
Conclusion
Credicorp enters the next three years with strong fundamentals: double‑digit recent growth, high‑teens ROE, and robust margins, complemented by an appealing dividend supported by a 52.36% payout ratio. Shares have rerated meaningfully, with a 50.09% 12‑month gain and price action near the 52‑week high, making delivery against elevated expectations the central task. The balance sheet and operating cash generation suggest financial flexibility, and institutional sponsorship looks steady, though recent headlines indicate selective rebalancing. From here, performance likely tracks earnings and dividend progress: steady if growth normalizes, stronger if revenue momentum persists without a credit‑cost bite. Risks center on macro conditions, regulation, and credit quality. Overall, the setup appears constructive but not complacent—investors should expect periods of volatility around macro and regulatory news while focusing on whether margins, ROE, and dividend discipline remain intact.
This article is not investment advice. Investing in stocks carries risks and you should conduct your own research before making any financial decisions.