
HDFC Bank Ltd (HDFCBANK.NS) enters the next three years with solid profitability and a calmer share price. On a trailing basis, revenue stands at INR 2.74T and net income at INR 705.75B, translating to a 25.79% profit margin and 13.92% return on equity. The stock closed around INR 964, up 9.89% over 52 weeks, below its 50-day average (INR 984.25) but above the 200-day (INR 928.83), with a low 0.61 beta. Growth has slowed, with quarterly revenue up 1.10% year over year and earnings down 1.30%, while the bank maintains a 29.77% operating margin. A forward dividend of INR 11 (1.14% yield) and a 25.15% payout ratio balance reinvestment with cash returns. This note outlines potential paths to 2028, key drivers to monitor, and risks that could shift valuation.
Key Points as of September 2025
- Revenue: TTM INR 2.74T; quarterly revenue growth 1.10% year over year.
- Profit/Margins: Profit margin 25.79%; operating margin 29.77%; TTM net income INR 705.75B.
- Returns: ROA 1.73%; ROE 13.92%; revenue per share 179.02; diluted EPS 43.58.
- Balance sheet: Total cash (mrq) INR 1.43T; total debt INR 6T; book value per share INR 354.29.
- Share price: ~INR 964.20; 52-week change 9.89%; high 1,018.85; low 806.50; 50-DMA 984.25; 200-DMA 928.83; beta 0.61.
- Valuation snapshot: Implied trailing P/E ~22.1x and P/B ~2.72x (based on price, EPS and BVPS).
- Dividend & actions: Forward dividend INR 11 (1.14% yield); payout ratio 25.15%; ex-dividend 7/25/2025; last split 2:1 on 8/26/2025.
- Market cap & ownership: Approx. INR 14.8T (price × 15.36B shares); institutions hold 56.13%; insiders 0.29%.
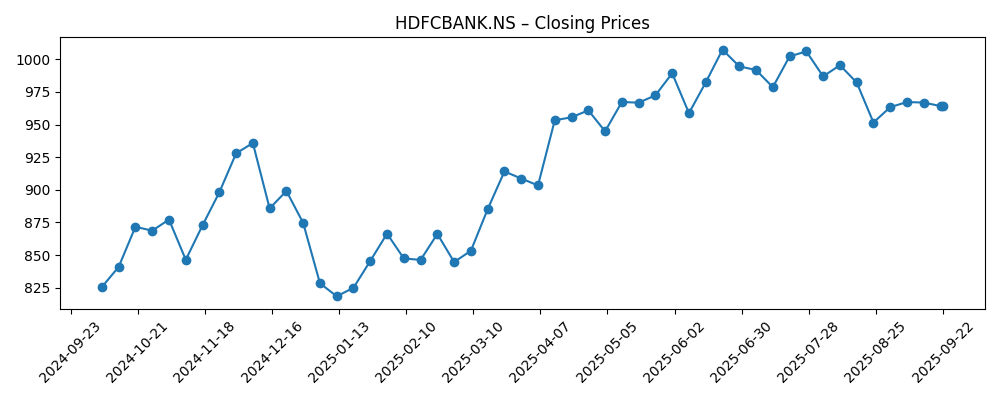
Share price evolution – last 12 months
Notable headlines
- Two Stocks That Delivered Consistent Annual Returns For A Decade
- Stocks To Watch: Kotak Mahindra, IndusInd, HDFC Bank, Maruti Suzuki, BEL
- Top gainers & losers today, 18 September: HDFCBANK among movers
Opinion
Reliable compounding is central to the HDFC Bank equity story, and recent coverage highlighting a decade of consistent returns underlines why the shares often command a premium. Today’s fundamentals show a defensible profitability profile (25.79% profit margin, ROE 13.92%), yet the growth pulse is subdued with 1.10% revenue growth and a 1.30% earnings decline year over year. In our view, a path to a higher multiple will likely require faster top-line expansion while sustaining operating discipline (29.77% margin). Without that, the current valuation—implied P/E ~22.1x and P/B ~2.72x—seems fairly anchored to steady, not spectacular, outcomes. Over a three-year horizon, stabilizing growth while preserving returns could still produce reasonable shareholder results augmented by dividends.
Technically, the stock sits between key trend markers—below its 50-day moving average (INR 984.25) but above the 200-day (INR 928.83)—after a 9.89% 52-week rise. That posture suggests a market waiting for clearer catalysts. Liquidity looks supportive (average 3-month volume 16.66M), while the July ex-dividend date and the 2:1 split on 8/26/2025 may incrementally broaden ownership and improve trading dynamics. The 52-week high at 1,018.85 is a visible reference for momentum investors; conversely, the 200-day average provides a first line of downside context. In the absence of stronger growth signals, we expect the shares to oscillate around these levels as fundamentals do the talking.
Income visibility matters more when growth is modest. The forward dividend of INR 11 (1.14% yield) and a prudent 25.15% payout leave room to fund expansion while offering a baseline return. With a beta of 0.61, the stock’s lower historical volatility can appeal to long-only investors seeking steadier compounding, especially given the bank’s scale (approx. INR 14.8T market cap). Still, investors will watch whether EPS (TTM 43.58) can inflect higher from here. Sustained ROE at or above the current 13.92% alongside improving revenue per share (179.02) would support a case for multiple resilience, even if macro conditions remain mixed.
What could change the trajectory? Headlines that bring the bank into daily market focus often coincide with portfolio rebalancing, but durable re-rating usually follows operating progress. We would monitor the quarterly revenue growth line for an upshift from the current 1.10% pace and signs that earnings growth turns positive. Balance-sheet indicators—total cash (INR 1.43T), debt (INR 6T), and book value per share (INR 354.29)—provide ample room for measured growth and capital returns, yet any deterioration in margins or ROA (1.73%) would narrow that room. Over three years, maintaining discipline while nudging growth higher appears the central task to justify a move toward the upper end of recent trading references.
What could happen in three years? (horizon September 2025+3)
| Scenario | Operating performance | Valuation & share price | What to watch |
|---|---|---|---|
| Best | Revenue growth accelerates from the current 1.10% yoy run-rate; profit and operating margins remain close to current levels (mid-20s/near-30%); ROE improves above 13.92%. | Multiple holds or expands from ~22x P/E and ~2.7x P/B; price sustains above the 50-DMA and challenges the 52-week high (1,018.85). | Positive earnings inflection, stronger fee and interest income, stable asset quality proxies, benign funding costs. |
| Base | Growth stays low-single-digit; margins and ROE hover around current prints (25.79% profit margin, 29.77% operating margin, ROE near 13.92%). | Valuation roughly steady; share price ranges around moving averages (50-DMA 984.25 – 200-DMA 928.83) with periodic swings. | In-line quarterly prints; steady dividend (INR 11 forward) and payout (25.15%) underpin total returns. |
| Worse | Revenue growth slows or turns negative; margins compress; ROE drifts below current levels; EPS under pressure. | Multiple compresses; price re-tests longer-term supports, with risk toward the 52-week low (806.50). | Rising funding costs, weaker demand, adverse regulatory developments, or higher credit costs weighing on earnings. |
Projected scenarios are based on current trends and may vary based on market conditions.
Factors most likely to influence the share price
- Trajectory of quarterly revenue and earnings growth from the current 1.10% and -1.30% yoy readings.
- Margin resilience versus funding and operating cost pressures (profit margin 25.79%; operating margin 29.77%).
- Return metrics and capital generation (ROE 13.92%; ROA 1.73%) supporting balance-sheet strength and book value compounding.
- Capital return policies (forward dividend INR 11; payout 25.15%) and any changes to dividend timing after the 7/25/2025 ex-date and 8/26/2025 split.
- Market tone and liquidity (beta 0.61; average volumes) affecting valuation bands around P/E ~22x and P/B ~2.7x.
Conclusion
HDFC Bank’s investment case into 2028 rests on steady profitability and the potential for a measured pickup in growth. Today’s profile—profit margin 25.79%, operating margin 29.77%, ROE 13.92%—supports a valuation of roughly 22x earnings and 2.7x book, which appears reasonable while revenue expands modestly (1.10% yoy). The share price at ~INR 964 sits between key averages, up 9.89% over 12 months, suggesting investors await higher-conviction catalysts. A prudent dividend (INR 11 forward; 25.15% payout) and lower beta (0.61) help anchor total returns and reduce volatility. To shift the narrative meaningfully, the bank needs clearer evidence of accelerating top-line and earnings growth without sacrificing returns. If it delivers that balance, a durable re-rating is possible; if not, expect range-bound trading around fundamental markers with dividends contributing a steady share of outcomes.
This article is not investment advice. Investing in stocks carries risks and you should conduct your own research before making any financial decisions.