
Procter & Gamble enters the final stretch of the year with a share price that has trailed the market even as fundamentals remain resilient. The company posted modest top‑line progress, with recent quarterly revenue up 3% year over year, while cost relief and productivity kept margins firm. The stock’s decline of -9.93% reflects a shift away from defensive consumer staples and investor focus on growth sectors, rather than a break in cash‑generation. In household and personal care, the industry is transitioning from inflation‑driven price hikes to a more normal cadence, which puts more attention on volume, mix, and brand support. For P&G, that means sustaining premium positioning through innovation and marketing, while managing foreign‑exchange swings and retailer dynamics. This matters for investors because valuation in staples often hinges more on stability and cash returns than on rapid growth; small changes in pricing power or input costs can move the earnings path meaningfully. The next phase will test how durable recent efficiency gains are as pricing normalizes.
Key Points as of October 2025
- Revenue: trailing twelve‑month revenue of 84.93B; most recent quarterly revenue growth 3% year over year.
- Profit/Margins: operating margin 27.58% and profit margin 19.74%; return on equity 31.90%.
- Cash generation: operating cash flow 18.92B and levered free cash flow 12.2B support ongoing shareholder returns.
- Balance sheet: total debt 35.95B, cash 11.17B; current ratio 0.71 (typical for staples with efficient working capital).
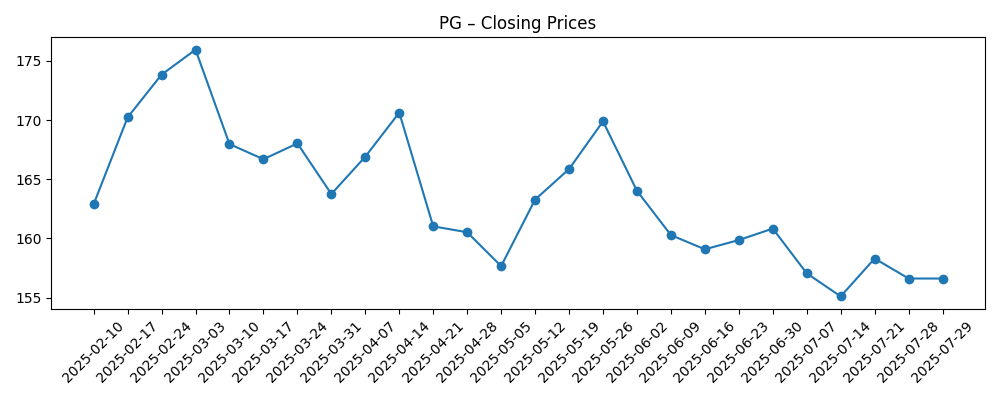
- Share price: recent close 148.77; 52‑week change -9.93%; high–low 180.43–146.97; 50– and 200–day moving averages 154.27 and 161.01; beta 0.36.
- Market cap: around 348B based on 2.34B shares and recent price (implied from provided data).
- Dividend: forward yield 2.79% and payout ratio 60.24%; next dividend date 11/17/2025; ex‑dividend date 10/24/2025.
- Analyst/positioning: Street ratings not provided here; short interest 0.72% of float and short ratio 2.19 indicate limited bearish positioning.
- Qualitative: portfolio of daily‑use brands; FX (foreign exchange) and commodity costs are key swings; backlog not applicable in this sell‑through model.
Share price evolution – last 12 months
Notable headlines
Opinion
The latest figures paint a picture of resilience more than acceleration. Low single‑digit revenue growth paired with a strong operating margin suggests a mix of price carryover and productivity gains doing the heavy lifting. Quarterly earnings growth outpacing sales (up 20% year over year) is consistent with easing input costs and cost discipline, rather than a broad‑based volume surge. That distinction matters for sustainability: pricing tailwinds fade as competitors normalize promotions, so the durability of today’s margins will hinge on mix, innovation, and execution in core brands. The 52‑week share underperformance looks more like style rotation than a deterioration in business quality.
Cash generation remains the anchor. Operating cash flow and levered free cash flow comfortably cover the dividend, and the payout ratio of 60.24% sits within a prudent band for a mature staples leader. Returns on equity of 31.90% underline enduring brand and scale advantages, while a beta of 0.36 reinforces the defensive profile. The balance sheet carries 35.95B of debt and a lean current ratio of 0.71, which is common for staples that turn inventory and receivables quickly. Net, the financial posture supports continued investment behind brands and productivity while maintaining consistent cash returns.
Within the industry, the narrative is shifting from price to volume. As inflation cools, retailers are pushing for sharper promotions and private‑label offerings are more competitive. P&G’s playbook—innovation, marketing, and supply‑chain efficiency—aims to protect shelf space and defend premium tiers. FX remains a swing factor for global names; a stronger dollar can dilute reported growth even when local‑currency trends are steady. If P&G can stabilize volumes while holding most of the price/mix gains, the company should defend margins despite a more promotional backdrop.
For the multiple and story, macro matters. Defensive, low‑beta cash flows tend to lag when risk appetite favors cyclicals and growth, but they can re‑rate when rates ease or volatility rises. A steadier path for volumes, visible cost savings, and contained input costs would keep the quality premium intact. Conversely, if retailers force heavier price givebacks or if private label accelerates, the market may question how much of the recent margin expansion is structural. Over the next few years, the narrative likely pivots on volume elasticity and the pace of reinvestment behind brands rather than headline pricing.
What could happen in three years? (horizon October 2025+3)
| Scenario | Narrative |
|---|---|
| Best | Promotional intensity normalizes without major price givebacks; innovation supports premium tiers and improves mix; emerging‑market demand and benign FX add tailwinds; productivity programs offset wage and input inflation. Cash generation stays robust, supporting steady dividend growth and disciplined buybacks. |
| Base | Industry pricing decelerates and volumes grind higher but remain uneven by category; FX is a modest headwind; input costs are manageable. P&G sustains healthy margins through productivity and mix, keeps investing in brands, and maintains consistent cash returns with a stable valuation multiple. |
| Worse | Retailers push for aggressive price rollbacks as private label gains; FX turns adverse and commodities re‑inflate. Volumes do not fully offset pricing pressure, margins compress, and cash flow tightens, forcing a slower pace of cash returns and a de‑rating toward a more defensive stance. |
Projected scenarios are based on current trends and may vary based on market conditions.
Factors most likely to influence the share price
- Price/mix versus volume elasticity across fabric care, home care, and beauty.
- FX translation impacts and emerging‑market macro conditions.
- Commodity and logistics costs (pulp, resins, energy) and the pace of productivity savings.
- Retailer negotiation dynamics and promotional intensity affecting shelf space and trade spend.
- Capital allocation decisions on dividends, buybacks, and portfolio shaping/M&A.
Conclusion
P&G’s setup blends modest growth with high‑quality cash flows. Revenue is expanding at a measured pace while margins remain strong, supported by productivity and brand scale. Cash generation comfortably funds the dividend, and low beta signals defensive characteristics—even as the stock has lagged during a risk‑on tape. The industry backdrop is shifting toward volume and value, which will test pricing power but could reward brands that execute on innovation and supply‑chain agility. If volumes stabilize and FX and inputs stay manageable, the company can preserve its quality premium; if promotions intensify or private label accelerates, the narrative may tilt more defensive. Watch next 1–2 quarters: volume trends in key categories; pricing cadence and promotional intensity; FX translation; input‑cost trajectory; brand investment and innovation throughput. These will determine whether recent margin gains prove structural and how investors frame the multi‑year path.
This article is not investment advice. Investing in stocks carries risks and you should conduct your own research before making any financial decisions.