
As of
Key Points as of September 2025
- Revenue: TTM $49.73B; Gross profit $28.81B; EBITDA $15.4B; Net income $5.66B; EPS (ttm) 4.54.
- Profit/Margins: Profit margin 11.38%; Operating margin 10.65%; ROE 12.71%; ROA 5.76%.
- Sales/Backlog: No formal backlog disclosed; performance tied to upstream volumes and downstream margins. Strong OCF ($14.42B) and LFCF ($7.23B) highlight cash conversion.
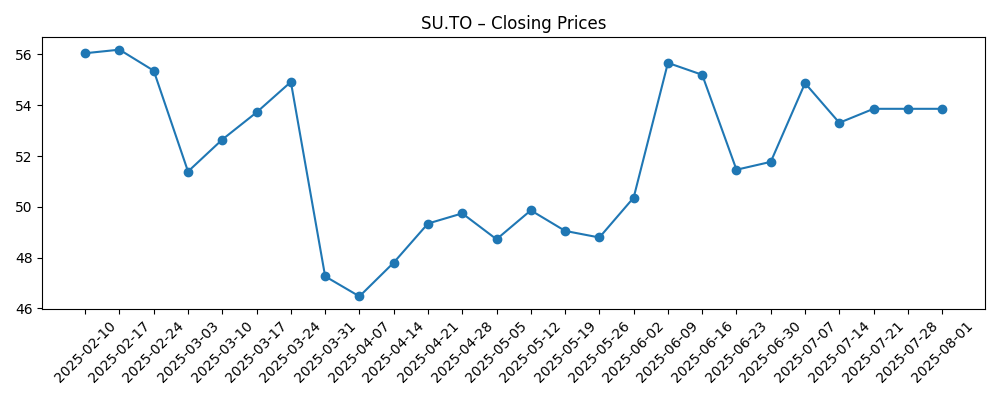
- Share price: Recent close ~$57.75; 52‑week range 43.59–58.71; 50‑DMA 54.56; 200‑DMA 53.03; 52‑week change +15.69%.
- Balance sheet: Total debt $14.28B; Debt/Equity 32.03%; Current ratio 1.26; cash $2.27B.
- Dividend: Forward rate $2.28 (yield 3.95%); trailing $2.24; payout ratio 49.67%; ex‑div 9/4/2025; pay date 9/25/2025.
- Analyst view: Recent target updates range around C$57–C$77; options activity noted; insider buying reported.
- Market cap & ownership: Approx. $70B based on ~1.21B shares and recent price; institutions hold 73.07%; short interest 7.44M (9/2/2025) vs 21.63M prior; short ratio 0.92.
Share price evolution – last 12 months
Notable headlines
- Wall Street Bullish on Suncor Energy Inc (SU), Here’s Why?
- Northern Trust Corp Increases Position in Suncor Energy Inc. $SU
- Analysts Set Suncor Energy Inc. (TSE:SU) Price Target at C$63.00
- Suncor Energy Sees Unusually Large Options Volume (NYSE:SU)
- Suncor Energy (TSE:SU) Sets New 1-Year High Following Insider Buying Activity
- Jefferies Financial Group Raises Suncor Energy (TSE:SU) Price Target to C$57.00
- Gerdes Energy Research Lowers Suncor Energy (TSE:SU) Price Target to C$77.00
Opinion
Investor interest around Suncor has firmed alongside improving price action and multiple research updates. The reported insider buying and the stock pressing a 1‑year high suggest management confidence and positive momentum signals. A forward dividend yield near 4% with a roughly 50% payout ratio, backed by $14.42B in operating cash flow, provides visible income support. The sharp drop in short interest into early September also indicates fading bearish positioning, which, if sustained, can reduce near‑term volatility. Against this, trailing quarterly revenue (‑7% YoY) and earnings growth (‑27.7% YoY) underscore the cyclical backdrop. Over three years, capital discipline and margin capture in both upstream and downstream units will be central to compounding returns.
Analyst targets cited in recent headlines span roughly C$57–C$77, framing a debate between steady cash return potential and macro sensitivity. In a constructive commodity tape, Suncor’s integrated model and scale can translate into sustained free cash flow, supporting dividends and opportunistic buybacks. The balance sheet (Debt/Equity ~32%) appears manageable, giving room to adjust capital spending without compromising shareholder returns. Should refining cracks or heavy‑light differentials move favorably, incremental earnings leverage could materialize faster than topline growth, given current margin structure. Conversely, prolonged weakness in refining or upstream realized prices could compress EBITDA and slow deleveraging, making the dividend the primary driver of total return.
Options activity flagged in August points to heightened expectations for catalysts. These could include capital allocation updates, potential portfolio optimizations, or operational reliability milestones. With institutions holding roughly 73% of float, large asset managers shifting positions—such as the Northern Trust addition—can influence liquidity and price discovery. From a technical lens, the stock trades above its 50‑ and 200‑day moving averages (54.56 and 53.03), reinforcing a constructive trend. However, the sharp pullback seen in late March illustrates how quickly sentiment can reset. Investors may prefer a staggered approach, adding on weakness toward longer‑term moving averages while watching spreads and downstream utilization indicators for confirmation.
On the income side, a payout ratio near 50% appears calibrated to cash generation, with room for moderate dividend growth if free cash flow holds near current levels. Over three years, the path to higher valuation likely runs through consistent operating execution, incremental margin gains, and disciplined capital returns rather than dramatic volume growth. If revenue stabilizes around the current $49.73B baseline while margins improve toward the upper end of recent history, free cash flow could remain robust. If macro or operational headwinds persist, management may lean more on cost control and portfolio prioritization to defend returns. Overall, risk‑reward skews toward steady compounding, with the caveat that commodity cycles can quickly challenge even well‑positioned operators.
What could happen in three years? (horizon September 2025+3)
| Scenario | Operating profile | Financial markers vs current baseline | Valuation and share price tone | What to watch |
|---|---|---|---|---|
| Best | Stable to improving upstream realizations and supportive refining margins; high asset reliability. | Revenue at or above the current $49.73B baseline with firmer margins; free cash flow sustained or higher; payout ratio maintained without leverage creep. | Premium to historical averages supported by consistent buybacks and dividend growth; trend above long‑term moving averages. | Heavy‑light differentials, crack spreads, uptime metrics, disciplined capex, continued reduction in net debt. |
| Base | Mixed commodity tape; normal maintenance cycles; steady execution. | Revenue roughly in line with the current baseline; margins fluctuate within recent bands; free cash flow adequate to fund dividend and selective buybacks. | Valuation near historical mid‑range; share price tracks cash returns and macro swings. | Quarterly cash flow cadence, cost discipline, capital return updates, institutional positioning. |
| Worse | Prolonged margin compression or operational setbacks; less favorable spreads. | Revenue below baseline with margin pressure; free cash flow narrows; payout growth pauses as leverage protection takes priority. | Discount to peers and history; shares mean‑revert toward longer‑term support levels. | Unplanned downtime, regulatory constraints, widening differentials, sustained weakness in refining cracks. |
Projected scenarios are based on current trends and may vary based on market conditions.
Factors most likely to influence the share price
- Commodity and refining margin moves (heavy‑light differentials, crack spreads) affecting realized prices and downstream profits.
- Capital allocation discipline (dividends, buybacks) relative to free cash flow and the ~50% payout ratio.
- Operational reliability and cost control, including maintenance timing and execution.
- Balance‑sheet management (debt at $14.28B, Debt/Equity 32.03%) and liquidity (current ratio 1.26).
- Investor positioning and sentiment signals (short interest trends, options activity, institutional flows).
- Policy and regulatory developments impacting emissions, permitting, or market access.
Conclusion
Suncor’s three‑year set‑up blends attractive income, defensible balance‑sheet strength, and sensitivity to cyclical forces. The company’s TTM revenue of $49.73B, double‑digit operating margin, and sizable cash generation ($14.42B OCF; $7.23B LFCF) provide capacity to fund a near‑4% forward dividend while maintaining flexibility. Recent price momentum near a 52‑week high, reduced short interest, and active analyst coverage support a constructive near‑term tone, though the prior quarter’s negative revenue and earnings growth underline macro exposure. If management sustains execution and allocates capital prudently, total returns can compound through dividends and opportunistic buybacks, with upside from favorable spreads. Conversely, weaker margins or operational disruptions could compress free cash flow and cap appreciation. For investors, the balance of evidence favors a steady, income‑anchored outlook while monitoring macro indicators and capital allocation signals as the primary drivers into the next cycle.
This article is not investment advice. Investing in stocks carries risks and you should conduct your own research before making any financial decisions.