
Toyota Motor Corp. (7203.T) is a Japanese global automaker that designs, manufactures and sells passenger cars, SUVs, pickup trucks and commercial vehicles under the Toyota and Lexus brands. The company competes with Volkswagen Group, General Motors, BYD, Tesla, Hyundai–Kia, Honda and Nissan across internal combustion, hybrid, battery‑electric and fuel‑cell segments.
Financially, Toyota reports trailing 12‑month revenue of 48.45T, gross profit of 8.5T, EBITDA of 6.87T and net income attributable to common of 4.27T; trailing profit and operating margins are 8.82% and 9.52%. Return on equity is 11.65% and return on assets 3.10%. The balance sheet shows total cash of 15.97T versus total debt of 38.44T, with a current ratio of 1.27. Operating cash flow stands at 4.89T and levered free cash flow at 1.31T. The forward annual dividend yield is 3.21% on a forward rate of 95, with a payout ratio of 27.68% and an ex‑dividend date of 9/29/2025.
Key Points as of September 2025
- Revenue: Trailing 12‑month revenue is 48.45T; quarterly revenue growth (yoy) is 3.50%, with revenue per share at 3,686.43.
- Profit/Margins: Profit margin is 8.82% and operating margin (ttm) 9.52%; EBITDA totals 6.87T; diluted EPS (ttm) is 325.15; quarterly earnings growth (yoy) is −36.90%.
- Sales/Backlog: Management commentary via recent coverage cites robust overseas vehicle sales; hybrid mix remains a competitive lever (see headline below).
- Share price: Recent close at 2,942.5 (9/24/2025). 52‑week range is 2,226.50–3,220.00; 50‑day MA 2,802.31 and 200‑day MA 2,747.40. 52‑week change is 13.26% vs S&P 500 at 16.76%. Beta (5Y) is 0.22. Avg 3‑month volume is 28.36M (10‑day 22.91M).
- Analyst view: Street details not provided here; investors are focused on margin durability, product mix (hybrid vs BEV), and capital returns.
- Market cap: Toyota is a mega‑cap automaker with 13.03B shares outstanding; float is 9.76B; insiders hold 15.13% and institutions 25.80%.
- Balance sheet: Total cash is 15.97T vs total debt of 38.44T; total debt/equity is 103.92%; current ratio stands at 1.27; book value per share is 2,765.22.
- Cash flow: Operating cash flow (ttm) is 4.89T; levered free cash flow is 1.31T.
- Dividend: Forward annual dividend rate is 95, implying a 3.21% yield; trailing rate is 90.00; payout ratio is 27.68%; last split 5:1 on 10/1/2021; next ex‑dividend date is 9/29/2025.
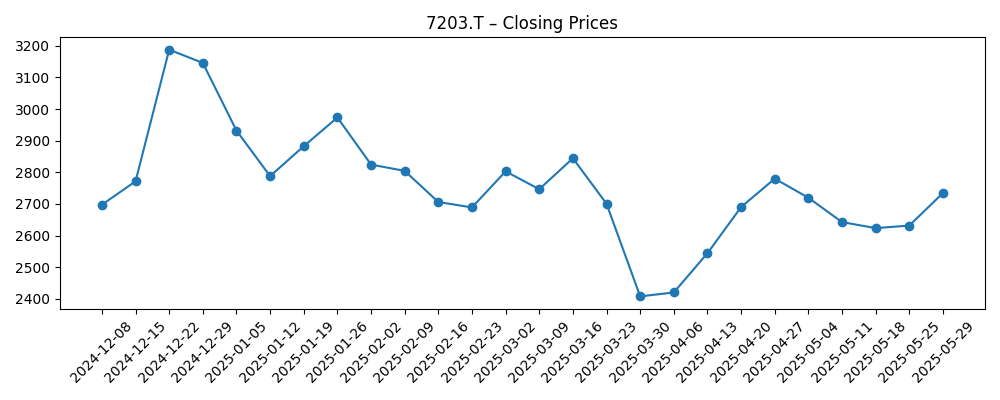
Share price evolution – last 12 months
Notable headlines
Opinion
Toyota’s current fundamentals depict a business with solid scale, healthy profitability and strong cash generation, albeit with mixed near‑term momentum. Revenue growth of 3.50% year over year contrasts with a sharp −36.90% year‑over‑year decline in quarterly earnings, implying margin pressure from pricing, incentives or mix costs. Against that backdrop, the company’s 8.82% profit margin and 9.52% operating margin (ttm) remain respectable for a mass‑market automaker. Toyota’s hybrid strength appears to be underpinning sales, as highlighted by recent coverage of robust overseas demand, but the investment case over the next three years hinges on the pace of electrification, battery cost curves and the company’s ability to protect margins while scaling next‑gen drivetrains.
Shares have been volatile over the past year, peaking near a 52‑week high of 3,220.00 and troughing at 2,226.50. The March 2025 weekly close at 2,407.5 marked a swing low before a recovery toward 2,942.5 as of September 24, 2025. Technical tone is neutral‑to‑constructive: the stock trades above its 50‑day and 200‑day moving averages of 2,802.31 and 2,747.40, respectively, with low historical beta (0.22) and improving participation (3‑month average volume 28.36M). This setup suggests the market is pricing steady, not sensational, progress.
Capital returns and balance sheet resilience are central to the medium‑term story. A forward dividend yield of 3.21% with a 27.68% payout ratio leaves room for disciplined increases if cash generation holds near the 4.89T operating cash flow (ttm) and 1.31T levered free cash flow figures. While total debt of 38.44T dwarfs cash of 15.97T, Toyota’s scale, captive finance operations and 1.27 current ratio indicate liquidity is manageable. The upcoming 9/29/2025 ex‑dividend date may be a near‑term trading catalyst, but sustained value creation rests on execution, not calendar events.
Looking out three years, the base case is that Toyota leans on hybrids as a profit bridge, incrementally expanding electrified offerings while avoiding severe margin dilution. Success would mean stabilizing earnings after the recent year‑over‑year dip, supported by product cadence and scale benefits. The bull case requires faster consumer adoption of Toyota’s electrified lineup and favorable input costs, leading to better margins and stronger free cash flow for buybacks and dividends. The bear case centers on stickier pricing pressure, adverse trade policy or slower tech transition, pressuring margins and limiting capital return flexibility. With 13.03B shares outstanding and broad global exposure, Toyota remains a core auto bellwether—execution on mix and cost will likely dictate whether the stock grinds higher or stalls.
What could happen in three years? (horizon September 2025+3)
| Scenario | How it plays out | What it means for 7203.T |
|---|---|---|
| Best | Hybrid leadership endures while battery‑electric offerings scale efficiently; input costs ease and supply chains remain stable. Operating discipline supports margins around current ttm levels or better as overseas demand stays firm. | Improved earnings quality and cash generation support steady dividend growth and potential buybacks; valuation could rerate if confidence in long‑term electrification strategy strengthens. |
| Base | Steady global demand with mixed regional trends; hybrids remain the profit engine while BEV ramp is gradual. Pricing is competitive but manageable; cost control offsets inflationary and regulatory headwinds. | Share price tracks fundamentals, with returns driven largely by dividends and modest multiple moves; volatility remains contained given low beta. |
| Worse | Pricing pressure intensifies and regulatory or trade frictions rise; electrification costs outpace savings, and supply constraints periodically resurface. | Margins compress from ttm levels, free cash flow tightens and capital returns slow; the stock de‑rates and trades closer to the lower end of its recent range until visibility improves. |
Projected scenarios are based on current trends and may vary based on market conditions.
Factors most likely to influence the share price
- Product mix and profitability of hybrids vs battery‑electric vehicles, including scaling costs and pricing power.
- Global demand and pricing discipline amid competition from legacy and pure‑play EV peers.
- Trade policy and regulatory changes in key markets (tariffs, emissions standards) affecting cost and access.
- Supply chain stability for batteries and semiconductors, and the impact on production cadence.
- Capital allocation (dividends, potential buybacks) versus investment needs; upcoming ex‑dividend dates as trading catalysts.
- Currency and macro factors that influence consumer demand and reported results.
Conclusion
Toyota enters the next three years with enviable scale, strong hybrid positioning and a record of disciplined execution. The numbers frame a balanced case: top‑line growth is positive (3.50% yoy), but recent earnings contraction (−36.90% yoy for the last quarter) underscores near‑term pressure on margins. Against that, profitability at the ttm level remains solid (8.82% profit margin; 9.52% operating margin), cash generation is healthy (4.89T operating cash flow; 1.31T levered free cash flow), and the dividend is well‑covered (3.21% forward yield; 27.68% payout). Shares have retraced from a 52‑week high of 3,220.00 and recovered from a March low of 2,407.5, now trading around 2,942.5 and above key moving averages. In our view, the base path is steady compounding: hybrids support margins while BEV investments advance, with capital returns providing ballast. Upside comes from faster electrified uptake and benign costs; downside stems from pricing pressure and policy risk. Execution on mix, cost and cadence will likely set the trajectory.
This article is not investment advice. Investing in stocks carries risks and you should conduct your own research before making any financial decisions.