
Goodyear Tire & Rubber enters the next three years with a tougher setup: shares have slid toward the low end of their 52‑week range as operating margins remain thin and levered free cash flow is negative. What changed is a combination of softer year‑over‑year revenue trends and elevated balance‑sheet leverage, alongside a reset in pricing power after the post‑pandemic spike in input costs. Why it changed: replacement tire demand has been uneven across regions, auto production is no longer a tailwind, and dealers are keeping inventories tighter, while foreign‑exchange and freight have normalized from extremes. Why it matters: with revenue at 18.49B but total debt at 8.98B, capital allocation flexibility is constrained, so execution on cost, mix, and cash conversion carries outsized weight for equity holders. Sector‑wide, global tire makers are navigating a shift toward larger‑rim and EV‑rated products, intense price competition in value segments, and volatile raw materials—factors that will define who earns through the cycle.
Key Points as of October 2025
- Revenue: trailing twelve months at 18.49B; quarterly revenue growth (yoy) at -2.30%, signaling demand softness and/or price normalization.
- Profit/Margins: profit margin 2.32% and operating margin 1.01%; EBITDA 1.44B underscores limited buffer to absorb input volatility.
- Earnings power: diluted EPS (ttm) 1.47 and ROE 8.99% aided by leverage; ROA 1.51% highlights asset‑intensity.
- Sales/Backlog: order backlog not disclosed; replacement channel remains the key driver, with OEM volumes sensitive to model mix and production schedules.
- Balance sheet and liquidity: total debt 8.98B; current ratio 1.15; cash 785M; levered free cash flow (ttm) -386.75M.
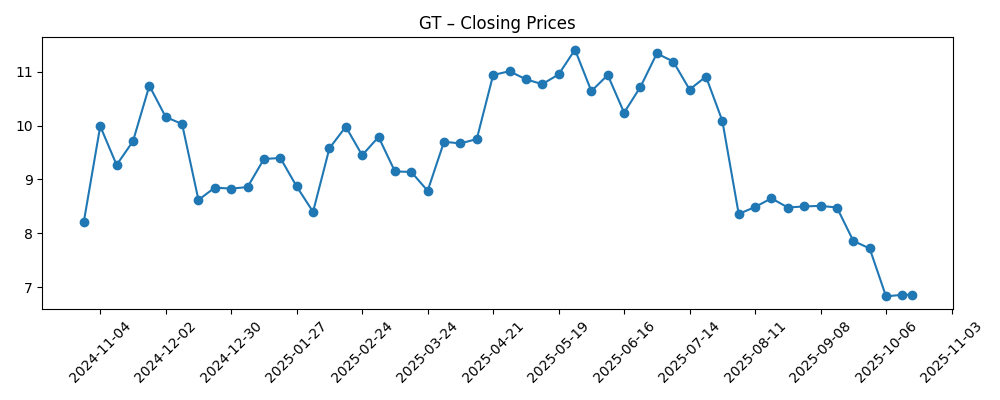
- Share price and trading: 52‑week high 12.03 vs 52‑week low 6.51; recent weekly close near 6.86; 50‑day/200‑day moving averages 8.05 and 9.54.
- Investor positioning: short interest 23.44M as of 9/30/2025 (up from 18.51M prior month), equal to 10.69% of float; beta 1.28.
- Market cap: implied equity value sits in the low‑single‑digit billions based on recent price and shares outstanding (exact figure fluctuates; not disclosed here).
- Dividend and policy: no current dividend (trailing yield 0.00%); last dividend date 3/2/2020; payout ratio 0.00%.
- Qualitative: competitive intensity remains high in value tiers; product mix shifting toward larger‑rim and EV‑rated tires; FX and raw materials remain key external variables.
Share price evolution – last 12 months
Notable headlines
Opinion
The latest run‑rate tells a clear story: revenue has eased year over year and margins remain thin. That combination, plus negative levered free cash flow, explains why the stock has tracked toward the lower end of its range despite solid year‑on‑year earnings growth off a weak base. The quality of the profit improvement is mixed—net income benefits from prior pricing actions and cost saves, but the operating margin at 1.01% leaves little room for error. In tires, small percentage shifts in input costs or mix can swing profitability; with profit margin at 2.32%, incremental gains must come from cost discipline, mix upgrade, and tighter working‑capital control.
Balance sheet leverage is the swing factor for equity narrative over the next three years. Total debt at 8.98B and a current ratio of 1.15 constrain optionality and raise the bar for any growth or restructuring investments. Cash at 785M provides a cushion, but with operating cash flow at 498M and levered free cash flow negative, the sequence must be: protect price/mix, reduce structural costs, and convert earnings into cash. The uptick in short interest to 23.44M signals investor skepticism about that conversion, amplifying sensitivity to each quarterly print.
Industry structure is not broken, but it is shifting. Replacement demand is the profit engine, while OEM tends to be lower margin yet important for technology showcase—especially for EV‑rated and larger‑rim tires. As competitors emphasize premium SKUs and service ecosystems, pricing power accrues to brands that can demonstrate measurable performance and durability. Conversely, value segments remain crowded, with imports pressuring price. If raw materials and freight stay relatively benign versus 2022 peaks, Goodyear can grind margins higher, but any commodity spike would quickly test the thin operating buffer.
How that plays into valuation: a consistent story of margin repair, improving cash conversion, and lower net leverage could reset the multiple closer to quality peers; a stalled mix upgrade or renewed input inflation would anchor the narrative to balance‑sheet risk. With no dividend and limited excess cash, equity holders are paying for execution rather than financial engineering. The path to a better narrative runs through sustained pricing discipline, a higher share of premium/EV tires, and demonstrable progress on working capital—outcomes that would make each turn of EBITDA feel more durable in a cyclical end‑market.
What could happen in three years? (horizon October 2025+3)
| Scenario | Narrative |
|---|---|
| Best | Input costs remain manageable, mix shifts toward premium and EV‑rated products, and cost actions stick. Replacement demand stabilizes, OEM contracts emphasize higher‑value fitments, and cash conversion improves, enabling gradual deleveraging. The story pivots from survival to quality of earnings, supporting a more durable valuation narrative. |
| Base | End‑market demand stays choppy but not collapsing. Pricing mostly holds, with selective promotions to defend share. Margins edge up on efficiencies, but balance‑sheet constraints persist, keeping strategic flexibility limited. Equity perception improves slowly as execution becomes more consistent, though volatility remains elevated. |
| Worse | Raw materials and logistics re‑inflate while replacement volumes soften and OEM mix tilts toward lower‑margin programs. Pricing discipline erodes amid heavy competition, cash generation lags, and leverage becomes the core concern. Equity narrative centers on liquidity management and asset optionality rather than growth. |
Projected scenarios are based on current trends and may vary based on market conditions.
Factors most likely to influence the share price
- Raw material and freight costs (natural rubber, petrochemicals, logistics) impacting gross margin trajectory.
- Pricing discipline and product‑mix shift toward premium and EV‑rated tires in replacement channels.
- Cash conversion and leverage management, including working‑capital intensity and potential asset portfolio actions.
- OEM production levels and model mix, especially larger‑rim fitments that carry better economics.
- Foreign‑exchange swings across key regions affecting reported revenue and profitability.
- Competitive dynamics from lower‑priced imports and regional players pressuring volume and price.
Conclusion
Goodyear’s three‑year setup is a balance between incremental margin repair and the drag of leverage. The numbers point to a business that can earn, but with a narrow operating buffer and tighter liquidity, execution carries outsized consequences for equity value. Sector dynamics—uneven replacement demand, a slow OEM backdrop, and a mix shift to larger‑rim and EV tires—create room for differentiation if price, performance, and service reinforce one another. Meanwhile, investor positioning (higher short interest) highlights skepticism that cash generation will keep pace with earnings. The pathway to a better narrative is straightforward, if not easy: hold price, upgrade mix, reduce structural costs, and convert more of EBITDA into cash sufficient to chip away at debt. Watch next 1–2 quarters: pricing resilience in North America; replacement vs. OEM mix; raw‑material and freight direction; working‑capital turns and free‑cash‑flow seasonality; and any signals on portfolio simplification or deleveraging cadence.
This article is not investment advice. Investing in stocks carries risks and you should conduct your own research before making any financial decisions.