
As of
Key Points as of September 2025
- Revenue: TTM revenue of $24.1B; latest quarterly revenue growth of 33.8% year over year.
- Profit/Margins: Operating margin (ttm) 12.15%; profit margin 8.52%; ROE 43.83% reflects capital efficiency.
- Sales/Backlog: Commercial activity remains robust as implied by 33.8% YoY revenue growth; operating cash flow totals $8.47B.
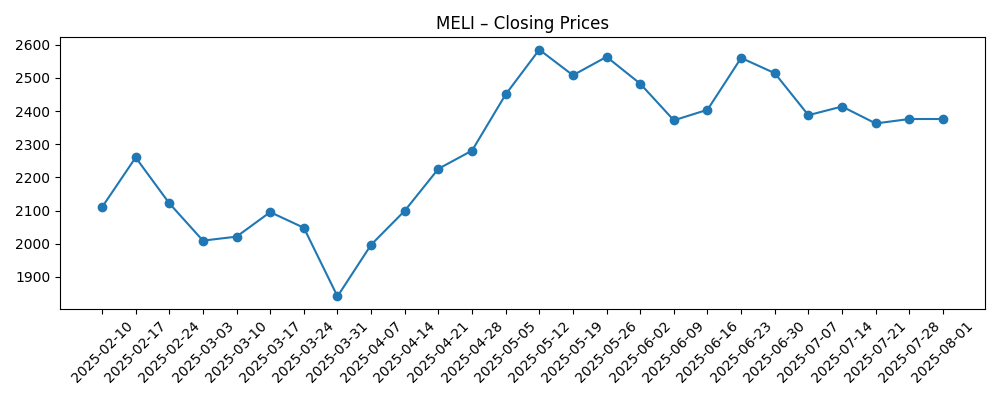
- Share price: Latest weekly close near $2,339 (9/12/2025); 52‑week range $1,646–$2,645; beta 1.49. 50‑day MA $2,385.80; 200‑day MA $2,182.89.
- Analyst view: JPMorgan raised its target despite rising competition concerns; Citi trimmed its PT to $2,850 but kept Buy.
- Market cap: Roughly $118B based on ~$2,339 share price and 50.7M shares outstanding.
- Balance sheet: Cash $3.98B vs. total debt $9.01B; debt/equity 157.71%; current ratio 1.20.
- Ownership/liquidity: Institutions hold 84.78%; short interest 1.69% of float; avg 3‑month volume ~345k; 10‑day ~410k.
- Performance: 52‑week change +11.11% vs. S&P 500 at +16.89%.
Share price evolution – last 12 months
Notable headlines
- JP Morgan Raises MercadoLibre (MELI) Target Despite Rising Competition Concerns
- MercadoLibre (MELI) Rose due to Robust Performance And Operating Margins
- MercadoLibre, Inc. (MELI): A Bull Case Theory
- Citi Lowers MercadoLibre (MELI) PT to $2,850, Maintains a Buy Rating
- MercadoLibre, Inc. $MELI Shares Purchased by Brooklyn Investment Group
- MercadoLibre, Inc. $MELI Shares Sold by EP Wealth Advisors LLC
- MercadoLibre, Inc. $MELI Shares Purchased by Advisors Asset Management Inc.
Opinion
MercadoLibre’s share price has traveled a wide arc over the last six months, falling to late‑2024 lows near $1,720, rallying to May weekly closes above $2,580, and settling recently around $2,339. The stock sits modestly below its 50‑day moving average but comfortably above its 200‑day trend line, a setup that often signals consolidation after a strong run. Over the past year, MELI is up 11.11%, trailing the S&P 500’s 16.89%, which could leave room for catch‑up if fundamentals continue to surprise positively. The 52‑week range of $1,646–$2,645 underscores elevated volatility consistent with a 1.49 beta. Price‑target changes in recent months point to a market still calibrating growth durability versus competitive risk. In our view, the path of least resistance is driven less by top‑line direction (clearly strong) and more by the market’s confidence in sustained margins and balanced capital allocation.
Profitability is a core support. With a 12.15% operating margin and 8.52% profit margin on $24.1B of trailing revenue, MELI demonstrates that scale in Latin American e‑commerce and payments can be monetized. Return on equity of 43.83% highlights effective use of capital, though leverage amplifies that signal. The balance sheet mix—$3.98B cash versus $9.01B debt and a 157.71% debt‑to‑equity ratio—invites closer scrutiny of funding costs and risk appetite, especially alongside a 1.20 current ratio. Importantly, operating cash flow of $8.47B provides substantial internal resources. The contrast with negative levered free cash flow of $-3.82B suggests heavy reinvestment or balance‑sheet uses that can depress near‑term free cash but may build competitive advantages. Investors will likely reward evidence that such spending is translating into durable margin expansion and ecosystem lock‑in, rather than transient growth.
Competition remains the swing factor, as highlighted by JPMorgan’s target hike “despite” rising competitive concerns. In practice, this means investors are weighing the breadth of MELI’s ecosystem—commerce, payments, logistics, and credit—against rivals encroaching on each layer. Pricing or subsidy battles could compress take rates or margins, while slower‑than‑expected monetization in newer services could dampen operating leverage. Conversely, scale advantages in logistics density and payments acceptance tend to be self‑reinforcing, improving unit economics as volumes rise. The company’s demonstrated growth—33.8% quarterly revenue growth year over year—indicates demand remains resilient. If management sustains efficient growth while protecting credit quality and merchant experience, the market can look through periodic competitive noise. The analyst community’s broadly constructive stance, even when trimming price targets, implies that execution, not the opportunity size, is the primary question for the next leg of returns.
Positioning and flows may add to volatility but also to upside optionality. Institutional ownership is high at 84.78%, while short interest remains low at 1.69% of float, limiting the chance of a violent short squeeze but also suggesting the bull thesis is widely owned. Average liquidity (about 345k shares over three months; higher over ten days) should accommodate incremental institutional demand without severe slippage. With approximately 50.7M shares outstanding, the market capitalization is roughly in the high‑$100 billions at recent prices, leaving the stock sensitive to incremental changes in long‑term margin or growth assumptions. If management proves that recent investments are producing durable efficiency and customer retention, valuation could drift higher even without multiple expansion; if not, the stock’s beta and range suggest it can quickly retest support on disappointments.
What could happen in three years? (horizon September 2025+3)
| Scenario | Growth | Margins | Credit/Fintech | Competition | Valuation/Stock |
|---|---|---|---|---|---|
| Best | Commerce and payments growth remains strong, with broad adoption across key markets. | Operating leverage improves; margins trend higher on logistics density and monetization. | Credit quality remains benign; funding diversified; cash generation strengthens. | Competitive intensity manageable; MELI extends ecosystem advantages. | Multiple stable or higher; stock outperforms broader market over the period. |
| Base | Healthy double‑digit expansion; growth normalizes from recent peaks. | Margins broadly stable with modest efficiency gains offset by reinvestment. | Mixed signals in credit; disciplined underwriting keeps losses contained. | Competition elevated but rational; share gains vary by country and category. | Returns track fundamentals; episodic volatility around earnings. |
| Worse | Growth cools amid macro or regulatory headwinds; consumer demand softens. | Margins compress on pricing pressure and higher costs. | Credit metrics deteriorate; funding costs rise; free cash flow pressured. | Rivals intensify promotions; share shifts require higher spending. | Valuation compresses; stock underperforms with wider drawdowns. |
Projected scenarios are based on current trends and may vary based on market conditions.
Factors most likely to influence the share price
- Trajectory of revenue growth versus expectations, and the durability of ecosystem engagement.
- Margin direction, especially operating discipline amid logistics, payments and credit investments.
- Credit performance and funding costs within the fintech portfolio, affecting cash flow and risk.
- Competitive intensity across e‑commerce and payments, including pricing and incentive activity.
- Regulatory and tax developments in key markets that impact take rates or capital requirements.
- Macro and currency volatility in Latin America, influencing consumer demand and reported results.
Conclusion
MercadoLibre enters the next three years with enviable growth and credible profitability, but the debate shifts to sustainability and capital discipline. The company’s 33.8% quarterly revenue growth, 12.15% operating margin and 43.83% ROE point to a resilient franchise, while operating cash flow of $8.47B provides internal funding capacity. Offsetting these positives are a leveraged balance sheet (debt/equity 157.71%), a 1.20 current ratio and negative levered free cash flow, all of which make execution in logistics, payments and credit pivotal. The stock’s 52‑week range and 1.49 beta suggest continued swings around earnings and macro headlines. Analyst sentiment remains constructive—even as targets adjust—implying investors are focused on whether MELI can defend margins while compounding scale advantages. If management delivers steady growth and prudent risk management, the base case is continued value creation; if not, multiple compression and cash‑flow concerns could dominate.
This article is not investment advice. Investing in stocks carries risks and you should conduct your own research before making any financial decisions.