
Tesla, Inc. is a U.S.-based electric vehicle and energy company that designs, manufactures and sells battery EVs, energy storage systems and charging solutions, alongside software and autonomous driving features. It competes globally with legacy automakers shifting to EVs (Volkswagen, Toyota, GM, Ford), high-volume EV leaders (BYD), and newer pure-play peers (NIO, Rivian, Lucid), while also contending with tech-led competition in autonomy and AI capabilities.
Financially, Tesla reports trailing-12-month revenue of $92.72B and net income of $5.88B (profit margin 6.34%), supported by $16.21B gross profit and $11.44B EBITDA. Growth has cooled, with quarterly revenue down 11.80% year over year and quarterly earnings down 16.30%. Liquidity remains solid with $36.78B cash versus $13.13B total debt, a 2.04 current ratio, and $15.77B operating cash flow ($1.4B levered free cash flow). Diluted EPS is 1.69; ROE is 8.18% and ROA is 2.96%. Shares outstanding total 3.33B; the stock’s beta is 2.07. Over the past 52 weeks, TSLA is up 74.18% (S&P 500 +15.54%), trading in a 212.11–488.54 range.
Key Points as of September 2025
- Revenue: Trailing-12-month revenue is $92.72B, with quarterly revenue growth (yoy) at -11.80%.
- Profit/Margins: Profit margin 6.34% and operating margin 4.10%; diluted EPS (ttm) is 1.69; ROE 8.18% and ROA 2.96%.
- Sales/Backlog: Barclays forecasts 465,000 deliveries in Q3 (above consensus), while headlines note market share pressure in Europe.
- Share price: Recent weekly level was $423.39 on 2025-09-25; 50-day MA $347.51; 200-day MA $333.95; 52-week change +74.18%.
- Analyst/investor view: Wells Fargo reiterates Underweight with a $120 PT; Jim Cramer sees potential for better numbers; Aswath Damodaran disclosed selling shares.
- Market cap: Implied roughly $1.4–$1.5T at recent prices (3.33B shares × about $423–$443).
- Balance sheet/liquidity: $36.78B cash vs $13.13B total debt; current ratio at 2.04.
- Short interest: Short % of float 2.78%, short ratio 1.01; average 3‑month volume 89.33M.
- Strategy/technology: Mixed headlines—underwhelming India entry, market share loss in Europe, and praise for AI advances.
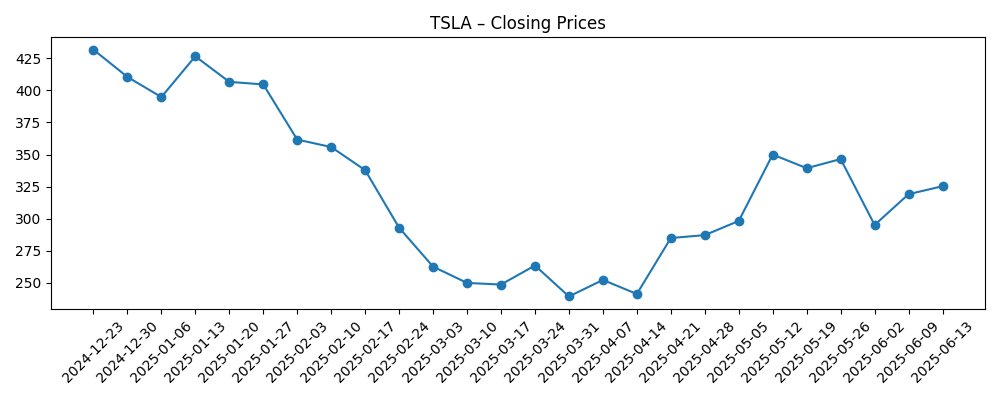
Share price evolution – last 12 months
Notable headlines
- Tesla (TSLA)’s Entry into India Sees Underwhelming Results, Reports Bloomberg
- Jim Cramer Thinks Tesla, Inc. (TSLA) Might See Better Numbers
- Wells Fargo Reiterates Underweight on Tesla (TSLA), $120 Price Target
- Barclays Forecasts 465,000 Tesla (TSLA) Deliveries in Q3, Above Consensus
- Tesla (TSLA) Faces Market Share Loss in Europe but Wins Praise for AI Advances
- Was Cathie Wood Right About Tesla (TSLA)?
- Dean of Valuation Aswath Damodaran Tells Why He Sold Tesla (TSLA) Shares
Opinion
Tesla enters the next three years with a split narrative. Operating data show a reset—quarterly revenue down 11.80% year over year and quarterly earnings down 16.30%—while headlines spotlight delivery optimism (Barclays’ 465,000 forecast) and AI capability praise. The stock has rallied sharply, up 74.18% over 12 months and rebounding from late-March levels near $239 to $423–$443 recently. This creates a familiar spread between near-term fundamentals and longer-term optionality. If pricing discipline stabilizes and new software features gain traction, margin pressure could ease from today’s 4.10% operating margin, but competitive intensity in Europe and a slower India ramp argue for caution on volume-led recoveries alone.
Investor views remain polarized. Wells Fargo’s Underweight and $120 target underscores concerns about valuation and execution risk, while media voices like Jim Cramer flag potential for better numbers and some analysts see stronger deliveries. Aswath Damodaran’s decision to sell highlights how even supporters are recalibrating risk-reward after the run. The dispersion of views is amplified by Tesla’s high beta (2.07), meaning macro and sentiment can swing the stock more than peers. In this context, balance sheet strength—$36.78B cash versus $13.13B debt—provides strategic flexibility, but doesn’t eliminate execution hurdles.
Strategically, a mixed regional picture complicates the path. Headlines point to market share loss in Europe, implying ongoing price competition and a tougher promotional environment. Reports of an underwhelming India entry suggest that greenfield expansion may take longer, requiring localization and supply chain depth to achieve scale economics. On the other hand, recognition for AI advances could widen Tesla’s software monetization runway. If autonomy and in-vehicle AI features improve attach rates, they could diversify revenue beyond hardware and help defend margins without heavy price cuts.
For equity holders, the next leg likely hinges on proving growth durability rather than multiple expansion alone. With trailing revenue of $92.72B and EPS of 1.69, the market is discounting substantial improvements in mix, software contribution, or unit growth. Delivery outperformance against consensus would support the bull case, but sustained quarterly revenue and earnings growth will be needed to re-rate from here. Absent that, the shares may track broader risk appetite and technical levels (50-day at $347.51 and 200-day at $333.95), with volatility remaining elevated.
What could happen in three years? (horizon September 2025+3)
| Scenario | Description |
|---|---|
| Best case | Pricing normalizes, mix improves, and software/autonomy features gain wider paid adoption. Europe stabilizes despite competition, and expansion markets progress after initial setbacks. Margins expand from current levels as cost per unit declines and energy/storage contribute more consistently. The narrative shifts back to profitable growth and platform monetization. |
| Base case | Volume recovers unevenly, with selective price discipline. Software revenues grow but remain a modest share of total. Europe remains competitive; India and other new markets scale slowly. Profitability stays solid but not spectacular, and valuation tracks execution milestones and broader market conditions. |
| Worse case | Sustained price competition compresses margins, regional share losses persist, and monetization of software/autonomy lags expectations. Expansion markets underperform, and sentiment turns risk-off. Multiple contracts as growth visibility weakens, keeping the stock more range-bound and volatile. |
Projected scenarios are based on current trends and may vary based on market conditions.
Factors most likely to influence the share price
- Delivery trajectory and pricing discipline versus competitive responses, especially in Europe.
- Progress and uptake of software/autonomy features that could lift margins and diversify revenue.
- Execution in new markets (e.g., India) and the pace of localization and regulatory approvals.
- Cost reductions and manufacturing efficiency affecting gross margin resilience.
- Macro conditions and risk sentiment, amplified by TSLA’s high beta and large retail participation.
Conclusion
Tesla’s three-year setup balances cyclical normalization with structural optionality. The company enters this period with a strong liquidity position ($36.78B cash) and proven scale, yet recent fundamentals show a reset: quarterly revenue and earnings declines and modest operating margin. Headlines frame the push and pull—delivery optimism versus market share pressure and uneven international expansion. The path to a sustained re‑rating likely requires evidence of durable growth, either through improved mix and cost, or through higher-margin software contributions that mitigate the need for price cuts. Given the stock’s 74.18% 12‑month gain and elevated volatility, investors may see sharper reactions to quarterly delivery prints, margin trends, and updates on AI/autonomy initiatives. In our view, execution on software monetization and stabilization in key regions will be the swing factors separating a healthy recovery from a choppy range‑trade.
This article is not investment advice. Investing in stocks carries risks and you should conduct your own research before making any financial decisions.