
Roche’s shares have seesawed this year, as investors weigh modest top‑line growth against stronger profit momentum and a lower‑risk profile. The company’s market value sits near 229.90B, and the valuation gap between trailing and forward metrics suggests expectations for earnings to catch up. What changed is the mix and confidence: revenue grew modestly while earnings advanced faster on margin discipline and a stabilizing diagnostics base after the post‑pandemic reset. At the same time, sentiment has been buffeted by Swiss franc strength, regulatory pricing debates in the U.S. and Europe, and typical late‑stage pipeline timing. Because forward P/E at 13.62 implies the market is discounting better profitability, delivery on launches and diagnostics growth now matters more than incremental cost saves. In sector context, large‑cap biopharma and diagnostics are transitioning from pandemic hangovers and patent cliffs toward a phase where capital allocation, pricing resilience, and R&D productivity differentiate winners. For healthcare investors, Roche’s outlook hinges on execution: convert pipeline to revenue, protect margins, and keep cash conversion strong.
Key Points as of October 2025
- Revenue: trailing twelve‑month revenue is 63.49B, with quarterly revenue growth of 3.60% year over year as of the most recent quarter.
- Profit/Margins: operating margin stands at 36.14% and profit margin at 14.85%; diluted EPS is 11.73 and net income is 9.43B.
- Sales/Backlog: no formal backlog disclosed; visibility is anchored by recurring pharma demand and a normalized diagnostics base. Operating cash flow is 19.28B and levered free cash flow is 11.73B.
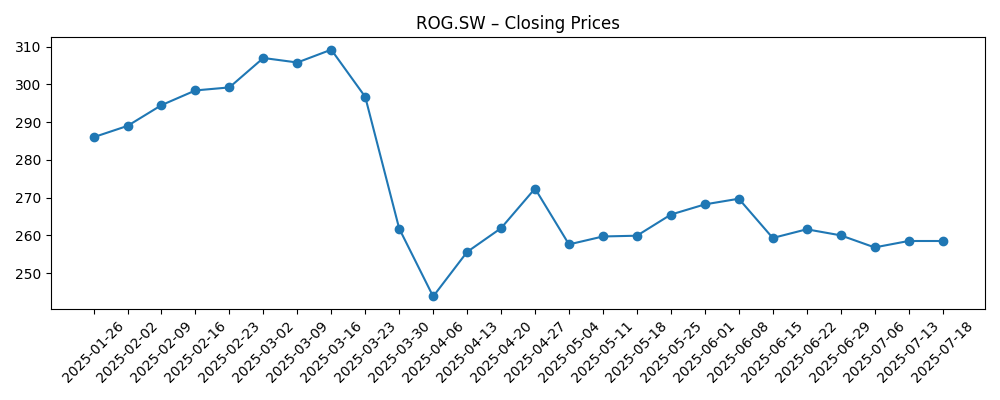
- Share price: the stock rallied into early March (near 307), fell to an April low (near 243), and recovered toward late‑October levels around 271. The 52‑week range is 231.90–313.80; 50‑day and 200‑day averages are 270.35 and 271.51. Beta is 0.18.
- Analyst view (proxy via valuation): forward P/E of 13.62 vs trailing 24.43 and a PEG of 0.72 imply expectations for earnings acceleration at moderate risk.
- Market cap and enterprise value: market capitalization is 229.90B; enterprise value is 250.90B; EV/EBITDA is 13.93.
- Dividend and capital returns: forward dividend yield is 3.57% with a payout ratio of 82.62%; the last dividend was paid on 3/31/2025.
- Balance sheet and liquidity: cash is 12.03B versus total debt of 34.63B; debt/equity is 104.81% and the current ratio is 1.29; book value per share is 36.01.
- Qualitative: product mix spans innovative medicines and diagnostics; FX (foreign exchange) exposure to the Swiss franc can influence reported growth; defensive profile supported by low beta.
Share price evolution – last 12 months
Notable headlines
Opinion
On the numbers, Roche enters the outlook period with modest sales growth but upgraded earnings momentum. Trailing twelve‑month revenue of 63.49B is growing slowly (recent quarterly revenue growth 3.60% year over year), yet earnings expanded faster (quarterly earnings growth 18.40%) as operating discipline and mix helped margins. The company’s operating margin at 36.14% and profit margin at 14.85% anchor the investment case: even small accelerations in top line can translate into outsized profit growth when overhead is contained. The gap between a trailing P/E of 24.43 and a forward P/E of 13.62 says the market expects that dynamic to continue. Cash generation backs this up, with operating cash flow of 19.28B and levered free cash flow of 11.73B providing flexibility. Put together, the quality of the recent beat‑style improvements looks driven more by underlying efficiency and product mix than one‑off items, which matters for durability.
Whether that momentum is sustainable depends on three areas: pricing, pipeline, and diagnostics. The dividend yield of 3.57% and payout ratio of 82.62% indicate most earnings are being returned, which limits room for aggressive buybacks unless profit grows. Still, the balance sheet is serviceable: total debt of 34.63B against cash of 12.03B and a current ratio of 1.29 suggests adequate liquidity, though leverage (debt/equity 104.81%) deserves monitoring if acquirer ambitions return. EV/EBITDA of 13.93 places Roche in the high‑quality, cash‑rich cohort where funding late‑stage trials and selective business development remains feasible through cycles. Diagnostics appears past the sharp post‑pandemic normalization, reducing a drag that obscured underlying pharma growth. The key question is whether new launches can replace erosion from older products fast enough to let margins hold while funding R&D. If yes, the earnings bridge implied by the low forward multiple can be crossed without financial strain.
Within large‑cap biopharma, competitive dynamics are evolving around oncology, immunology, and neuroscience while payors push for value. The U.S. Inflation Reduction Act and European health technology assessments increase pressure on mature franchises, elevating the importance of new‑to‑market therapies and companion diagnostics. Roche’s integrated model matters here: diagnostics can enable test‑and‑treat pathways that defend pricing and support uptake, while the pharma engine benefits from breadth rather than reliance on a single product. FX – foreign exchange – remains an external swing factor given Swiss franc strength versus key revenue currencies. Supply chains look more stable than in recent years, but regionalization and compliance costs continue to creep higher. These forces point to a setup where pricing power is earned through clinical differentiation and system value, not just brand incumbency.
That backdrop frames the stock’s narrative. The shares have underperformed the broader U.S. market over the past year (company change −3.41% vs S&P 500 at 16.02%), but carry a low beta of 0.18 and a covered dividend that many view as a floor. If pipeline delivery lifts sales from modest to steady growth and diagnostics contributes incremental margin, the market could reward the stock with a higher multiple from the current forward P/E baseline. If, instead, price cuts and biosimilar competition outpace launches, the valuation could gravitate toward cash‑flow yield and the stock may remain range‑bound around its moving averages (50‑ and 200‑day near 270.35 and 271.51). In short, the next phase of the story is less about further cost takeout and more about proving revenue durability that justifies compounding.
What could happen in three years? (horizon October 2025+3)
| Case | Narrative |
|---|---|
| Best | Multiple late‑stage readouts succeed, with timely approvals and solid uptake in core therapy areas. Diagnostics expands test menus and platforms, supporting integrated test‑and‑treat pathways. Margins hold near current levels as mix improves and cost discipline persists. Currency headwinds abate. The market rewards clearer growth visibility with a firmer narrative around durable compounding and steady dividend growth. |
| Base | New launches offset erosion from mature products, keeping revenue growth modest but steady. Diagnostics remains a stable contributor after normalization. Operating efficiency sustains healthy margins and cash conversion funds R&D and the dividend, while leverage trends lower gradually. Valuation tracks earnings with limited multiple change as investors await more evidence of acceleration. |
| Worse | Key trials disappoint or face delays, while pricing pressure intensifies under U.S. and EU frameworks. Biosimilar competition and weaker diagnostics volumes compress margins. FX remains unfavorable. Capital allocation stays conservative to protect the balance sheet and dividend cover, and the equity narrative reverts to bond‑like defensiveness with little scope for re‑rating. |
Projected scenarios are based on current trends and may vary based on market conditions.
Factors most likely to influence the share price
- Clinical and regulatory outcomes for late‑stage programs (approvals, complete response letters, label changes).
- Drug pricing frameworks in the U.S. (IRA negotiations) and EU health technology assessments affecting mature brands.
- FX swings versus the Swiss franc impacting reported revenue and margins.
- Competitive dynamics, including biosimilar entries and rival launches in core therapy areas.
- Diagnostics demand trends and pace of menu/platform introductions across laboratories and point‑of‑care.
- M&A or business development that reshapes the portfolio mix and leverage profile.
Conclusion
Roche’s three‑year setup blends high‑quality margins, reliable cash generation, and a valuation that already prices in better earnings. The data show slow but positive sales momentum alongside faster profit growth, with strong operating and profit margins and meaningful free cash flow. That combination can fund R&D and the dividend while absorbing regulatory and currency noise, provided new launches convert to revenue at a reasonable pace and diagnostics remains a steady contributor. The stock’s defensive traits and lag versus broader equities leave room for narrative repair if execution lands, but policy headwinds and FX could still blunt progress. Watch next 1–2 quarters: key pipeline milestones and launch trajectories; pricing and rebate trends under U.S./EU frameworks; FX translation effects; diagnostics volume/mix; operating margin discipline and cash conversion versus dividend outflows; leverage direction and any business development signals. These will indicate whether earnings can bridge from expectations to delivery and whether the multiple has room to expand.
This article is not investment advice. Investing in stocks carries risks and you should conduct your own research before making any financial decisions.